IBM Z, IBM Power Systems, LinuxONE and other wonders

After more than half of my life working with x86 architecture computers, I thought I already have seen most of what’s out there, until one day I stepped with a client that had one thing called, “THE MAINFRAME” in her Data Centre.

Back then I was an DevOps specialist in Test Automation and I was there, naive of me, to explain how could I help her to automate full manual testing operations performed over “THE MAINFRAME”. I was quite ready to have a discussion about how to rely on things like Cucumber, Selenium, Gatling, etc but I had no idea about the target system, I assumed it was a traditional x86 bunch of servers.

My surprised came when she started talking about z/OS, z.TPF, JCL, CICS, ZDEV0, LPARs and full list of acronyms that were totally alien to me.

If you haven’t ever worked with IBM Mainframes, you might be a bit lost like me, when someone talks to you about IBM Z, IBM Power Systems, LinuxOne, etc. In the end most of us just work daily with our shiny Macs, laptops or desktops and we access remotely fancy x86 VM machines running in some Cloud Data Centers.

Then you think, are Mainframes still that popular, are still needed, who on earth is still using them?

Reality is that today, behind the scenes, Mainframes are proccessing 300 Billion Transactions per day. Some comparative data: Google processes 3.5 Billion searches per day.

FACT: Did you know 92 of the top 100 banks in the world use the mainframe and they process 100% of all credit card transactions?

FACT: IBM Mainframes can run for 40 years, 24/7, without failing.

FACT: Nearly all Airline bookings are done on a Mainframe

FACT: 23 of the top 25 US retailers use Mainframe

FACT: 9 out of the top 10 insurance companies in the world use mainframe.

I’ve spent some time doing research to find out that, despite what some people claimed back in 2000ish, Mainframe is FAR AWAY from being dead, in fact, just the opposite.

This is why I decided to explore, learn and try to explain to fresh new mainframe ignorants like me, what IBM Mainframes are about.

A brief history of Mainframes

In 1950s IBM released the 700 series of Mainframes Vacuum Tube based Mainframes, with no OS installed on them. There were called the First Generation Mainframes.

A technologic jump happened when IBM moved into transistor based Mainframes, releasing the 7000 series. These were called the Second Generation Mainframes.

In 1964 IBM released the SYSTEM 360. It had an Operating System installed on it called OS/360. There were called the Third Generation of Mainframes and they would be the predecessor of the modern Z Series Mainframes. SYSTEM 360 was the way to standardise Hardware and Software for all the industries, as until then, each Mainframe was designed for a specific industry or scientific purpose and with no Operating System.

IBM computer family tree
Mainframe family tree and chronology. Nearly 40 years ago shows 33 members in three main branches. Today, such a tree would be far too tall and wide to fit on a single page.

FACT: SYSTEM 360 IBM Mainframes were used in the NASA Apollo 11 mission.

Over the following years, SYSTEM 360 evolved until turning into z Series:

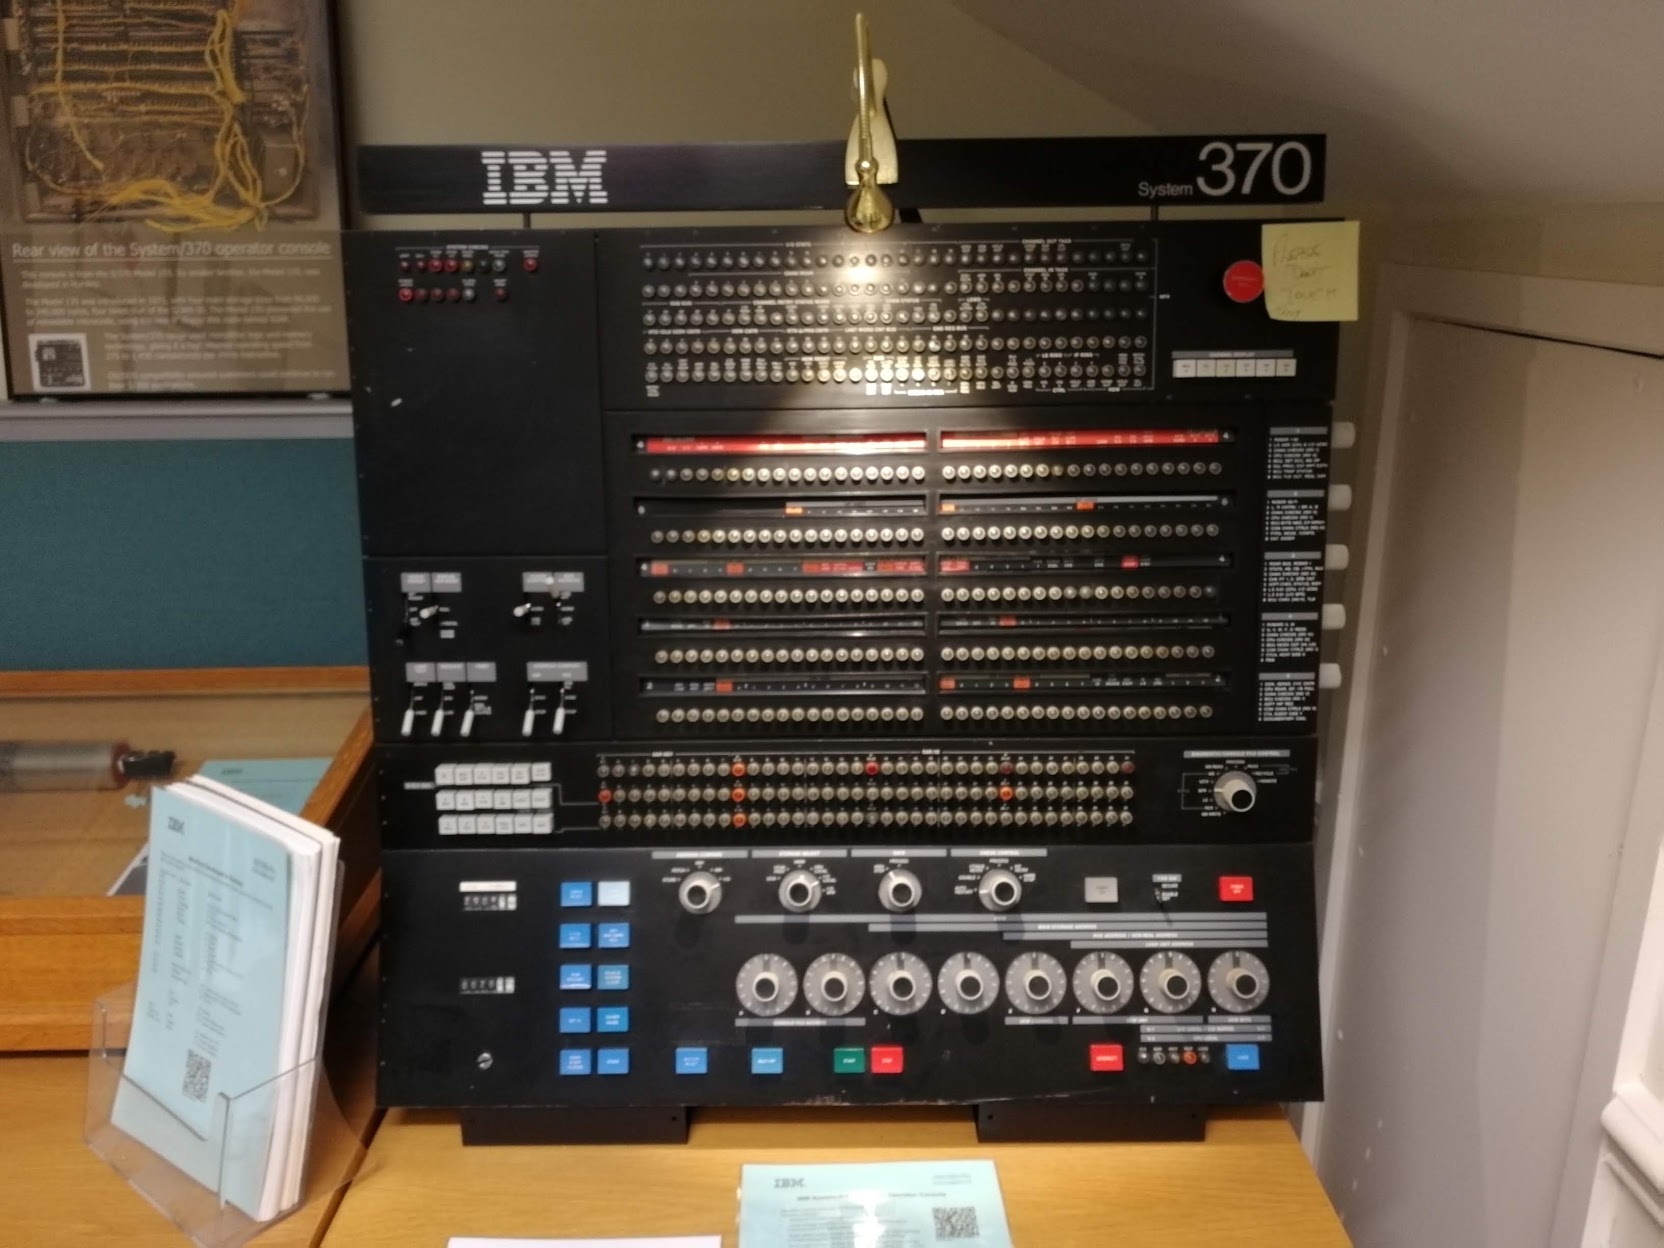
Year 1970: IBM launched SYSTEM 370
Year 1980: 3081, 3090, etc
Years 1990s: SYSTEM 390 comes up
Years 2000s: z Series appears

Just check this jaw dropping long list of mainframes.

In addition to the z Series Mainframes, in 2015 IBM released IBM LinuxONE, its first Linux based OS on the Mainframe.

Later in this article we will discuss about IBM Power Systems. Some people may think are Mainframes, but they are not, they are an inspired mid range enterprise machines/servers. In fact in the early days of Power, there was a PowerPC workstation and the microprocessor was also used in Apple Systems!

FACT: IBM Mainframes with 85-90% world market share is the leader.

That would put a bit of context, right?

In a nutshell

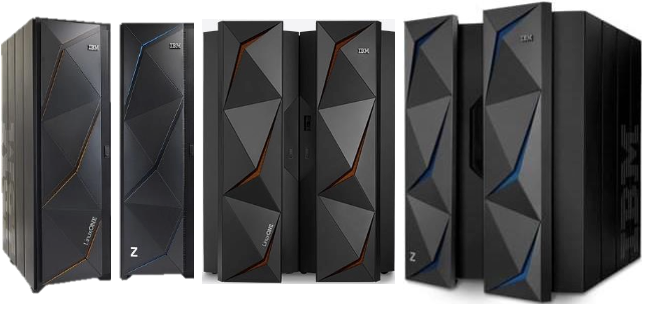
Mainframes: IBM Z family, IBM Linux One family
Mid range servers: IBM Power Systems

If you haven’t get lost at this point, you can continue, as things are getting more interesting now.

IBM Z History

IBM Z Mainframe History began in the 60s but we can find the Z branding around 1994 with the called z Systems and the introduction of CMOS technology.

zSystems were a Platform Independent IBM Mainframes that started on the zSeries 900 and were evolving and changing until what today we called the IBM Z

IBM Z Mainframe Life Cycle History
z Systems –> zSeries 900
z Systems –> zSeries 800
z Systems –> zSeries 890
z Systems –> System z9 EC
z Systems –> System z9 BC
z Systems –> System z10 EC
z Systems –> System z10 BC
z Systems –> zSeries 196
z Systems –> zSeries 114
z Systems –> zEnterprise EC12
z Systems –> z13
z Systems –> z13s
z Systems –> z14
z Systems –> z14 ZR1
z Systems –> z15
z Systems –> z15 TO2
Evolution of IBM Z (1994 – 2021)
IBM Z Family

IBM Z Operating Systems

The OS by excellence in IBM Z is known as z/OS. Used by IBM zSeries Mainframes, it uses Job Control Language as the scripting language. At the contrary of general purpose computers and Operating Systems, Z has Operating Systems designed for specific purposes.

Before IBM Z, mainframes have been using OS/360 Family: ACP (Airline Control Program), DOS/360 (Disk Operating System), TSS/360 (Time Sharing System), CP/67 (Virtual Machine)

  • z/OS: Unix System Services Operating System (2001), successor of the famous OS/360 which was born back in 1966. Several years and a dozen of evolutions after his birth OS/390 appeared in 1995, to finally getting consolidated in 2000 as z/OS.
  • z/VM: Run thousands of Linux on Z virtual machines on one system. Evolved from the CP-40/CMS (1967) over 12 distributions in the VM line, to end up in z/VM in the year 2000. Later we will deep into how IBM became the father of Virtualization.
  • z/VSE: Gain security and reliability for transactions and batch workloads. You probably have heard about its predecessors, DOS/360 or simply DOS? IT was the first of a sequence of operating systems for IBM System/360 and System/370. Back in time DOS/360 was the most widely used operating system in the world.
  • z/TPF: specially aimed at transaction based business operations. It started in 1947 with ACP, to develop into TPF in 1979 and then z/TPF in 2005.

FACT: IBM Z systems are flexible and run z/OS, Linux, z/VSE, z/TPF and z/VM

As part of the Z Operating Systems, you can find some components like KVM, which is an open source hypervisor that allows us to run thousands of Linux on Z virtual machines on one system.

In terms of server virtualization we can find:

  • LPAR Virtualization: Partition a physical server into logical partitions (LPARs) with protection certified to EAL5+.
  • IBM Hypervisor (within z/VM).
  • KVM

And of course, Linux! IBM Z supports distributions like Red Hat Enterprise, Suse Linux Enterprise and Ubuntu.

FACT: IBM z15 solutions are designed to deliver 99.99999% availability

Languages and technologies used in Mainframes

When using IBM Z mainframes, not Linux based, languages and technologies are not the same as the ones you can usually find in other architectures.

For example, the main scripting language we use in Mainframes is JCL (Job Control Language). Common application languages are COBOL, FORTRAN, C, C++, Java, REXX, etc.

You may heard about CICS (Customer Information Control System) which is used for online transactions. CICS is a family of mixed language application servers that works as a transaction engine on z/OS and z/VSE.

When you look into Databases, is pretty common to find DB2 and IMS.

And the more you dig the bigger is the number of tech you will find.

But, since we can run a Linux on a Mainframe, we can use any language 🙂

LinuxONE

LinuxONE (s390x) Servers were introduce in 2015, at the same time of IBM z13. Built on the IBM z14 mainframe and it’s z13 CPU, LinuxONE Emperor and the z12 processor based LinuxONE Rockhopper were launched during the LinuxCon.

FACT: Did you know that LinuxONE supports up to 8000 virtual machines with 32TB of memory and 170 dedicated processors?

LinuxONE III single-frame

LinuxONE was stated by IBM as the most secure Linux system ever with advanced encryption features built into both hardware and software, thanks to its dedicated crypto processors and cards. One of the main differences between Z and LinuxONE, is that the later was designed exclusively for the Linux operating system, including most commercial and open source Linux distributions.

IBM Z and LinuxONE platforms brought 20 years of open source software by the hand of Linux.

Open source ecosystem - logos

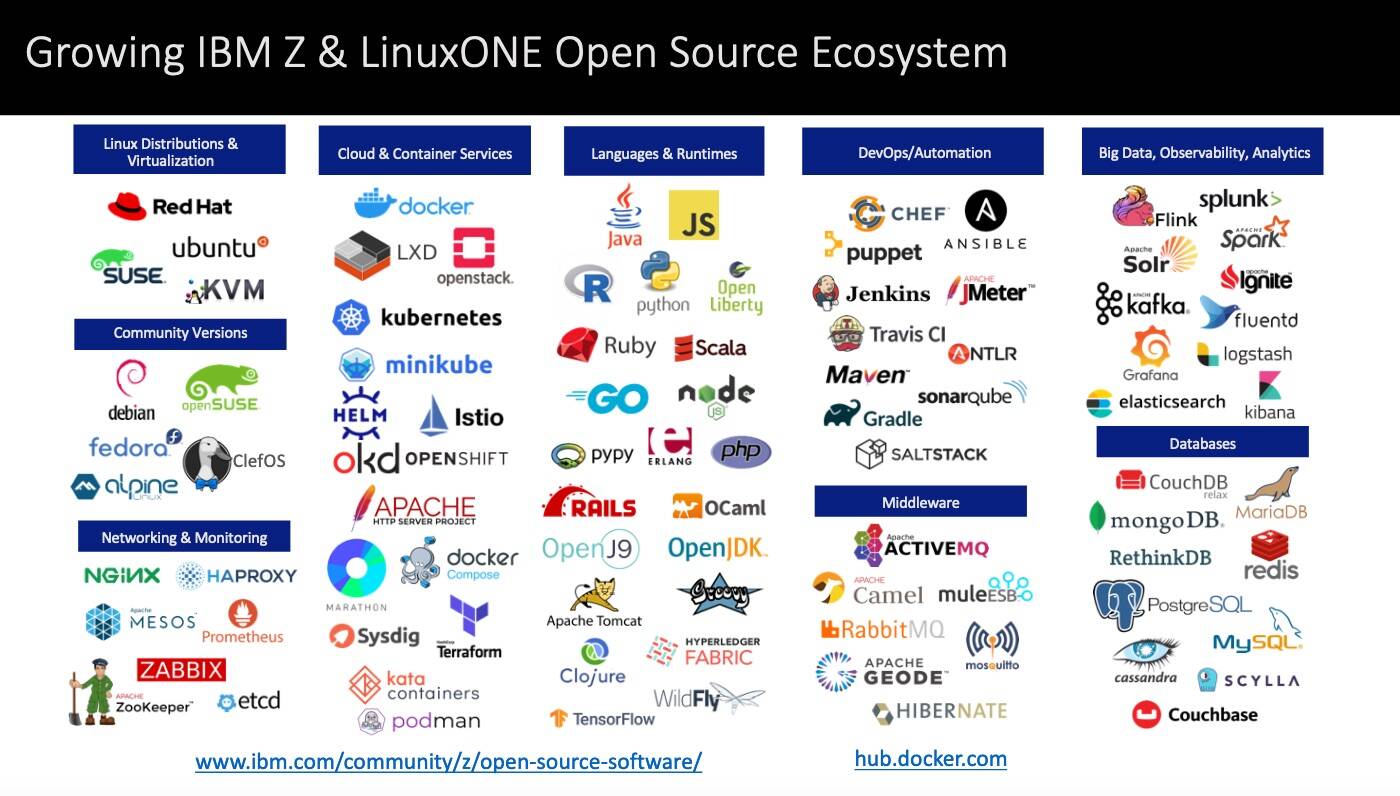
Of course LinuxONE has kept evolving fuelling digital transformations and journeys to secure hybrid cloud.

IBM LinuxONE Mainframe Life Cycle LinuxONE history
LinuxONE Emperor
LinuxONE RockHopper
LinuxONE Emperor II
LinuxONE Rockhopper II
LinuxONE III
Linux ONE III LT2

IBM POWER SYSTEMS

First of all, what POWER means? Performance Optimization With Enhanced RISC

And what RISC means? Reduced Instruction Set Computer.

RISC is a computer with a small, highly optimized set of instructions, rather than the specialised ones found in CISC (Complex Instruction Set Computer).

IBM firs RISC system was designed in 1975, it was called IBM 801.
PowerPC 601 was the first generation of microprocessors to support 32-bit PowerPC instruction Set.

To understand the IBM Power Systems, you have to understand a bit more about what is “powering them up”, in this case are the IBM POWER microprocessors.

Do you remember “Deep Blue”? That supercomputer that won its first game against world champion Garry Kasparov playing chess? That was using a POWER2 microprocessor of 120 MHz.

Do you remember “IBM Watson” computer system wining on Jeopardy! tv program? It was built on IBM’s DeepQA technology and employed 90 IBM Power 750 servers, each of which used a 3.5GHz POWER7 eight-core processors. It could process 500 gigabytes per second.

IBM has a series of high-performance microprocessors called POWER, followed by a number designating generation. From POWER1 to what’s coming out today POWER10, here is a list of them:

NameIntroducedClock
POWER1199020-30 MHz
POWER2199355-71.5 MHz
POWER31998200–222 MHz
POWER420011–1.3 GHz
POWER520041.5–1.9 GHz
POWER620073.6–5 GHz
POWER720102.4–4.25 GHz
POWER820142.75–4.2 GHz
POWER92017~4 GHz
POWER10coming soon

Given we have explained what processors are powering up IBM Power Systems servers, let’s find out more about what you can find in its family.

IBM Power Systems has two predecessors, POWER and PowerPC hardware lines. PowerPC was the IBM’s response to the market trend of midrange computers. If you look back in time to 1991 you will find that the alliance AIM (Apple-IBM-Motorola) created PowerPC.

PowerPC was intended for personal computers and was used for 1994-2006 by lines like Apple’s Macintosh, iMac, iBook and PowerBook. After 2006, Apple migrated to Intel’s x86 architectures. If you want to become a bit more nostalgic you can also look at AmigaOne and AmigaOS 4 personal computers, that also used to use PowerPC.

The IBM Power Systems, are not workstations, is fine tuned high performing line of servers which appear in 2008 after merging the two lines of server and workstations under the same name, Power, later called Power Systems, initially powered by POWER6 architecture. PowerPC line was discontinued after this.

IBM Power Systems example

Those machines could be designed as Scale Out servers, Enterprise servers or High Performance Computing for example.

If you want to check out how a POWER9 based server from the family of Scale Out servers, you can check this out:

  • Power Systems S924 â€“ 4U, 2× POWER9 SMT8, 8–12 cores per processor, up to 4 TB DDR4 RAM, PowerVM running AIX/IBM i/Linux.

You can also find Enterprise servers:

  • Power Systems E980 â€“ 1–4× 4U, 4–16× POWER9 SMT8, 8–12 cores per processor, up to 64 TB buffered DDR4 RAM.

Or High performance computing servers:

  • Power Systems S822LC for HPC “Minsky” â€“ 2× POWER8+ SCM (8 or 10 cores), 2U. Up to four NVLinked Nvidia Tesla P100 GPUs and up to 1 TB commodity DDR4 RAM.

Depending on the IBM Power System model, you will find servers with more or less cores sizes and performance. For example, within the POWER6 range you can find:

  • Blades (1-8 cores): JS22, JS12, 520, 550.
  • Mid-range (4-16 cores): 570
  • Enterprise (8-64 cores and up to 448): 595, 575

IBM Power Systems Operating Systems

In a nutshell, they run Linux, i for Business and AIX.

FACT: Did you know in 2020 IBM AIX remains as the #1 OS in the Unix market?

IBM AIX: An enterprise open standards-based UNIX made for Power Systems architecture.

IBM i: it runs on POWER system and supports older AS/400 workloads. Easily integrates with IoT, AI and Watson.

Haven’t your head blown up yet? Let me give you more as you probably have heard about systems such as AS/400, where this come from? Well, let’s check out the evolution of IBM i to find it out.

SystemYear
System/381978
System/361983
AS/4001988
IBM iSeries2000
IBM Power Systems i for Business2008
IBM Power9 i for Business2020
Evolution of IBM i

Within IBM Power we have seen introduced beautiful technologies, like the LPARs.

logical partition (LPAR) is a subset of a computer’s hardware resources, virtualised as a separate computer. Logical partitioning divides hardware resources. Two LPARs may access memory from a common memory chip, provided that the ranges of addresses directly accessible to each do not overlap. 

FACT: Did you know that IBM developed the concept of hypervisors (virtual machines in CP-40 and CP-67 by 1967) and in 1972 provided it for the S/370 as Virtual Machine Facility/370?

Yes IBM invented virtual machines, go and check in Wikipedia 🙂

LPAR (Logical Partitions was introduced in POWER4.

Dynamic Logical Partitions (DLPAR) was introduced not much after with the ability to move CPU, Memory and I/O slots/adapters between logical partitions while running in matter of seconds.

Later on Shared Processor Logical Partition were added, giving us the luxury of use discrete fractions of CPU cycles. Later Virtual I/O Server (VIOS) was introduced and eventually Micro-Partitions (Shared CPUs + Virtual I/O Server).

More recent technology is PowerVM, which runs i For Business, AIX and Linux over Power Hardware.

SUMMARISING

IBM Z today is pretty well recognised and well stablished in the market and today IBM Z is above the competition. Only IBM Z can encrypt 100% of application, database and cloud service data, while processing 30 billion transactions with 99.999% uptime.

On top of that IBM Z is built for cloud, ready for blockchain, optimized for machine learning, open for DevOps, and delivers 8.4x more effective security than x86.

IBM Power Systems keep providing cutting edge technologies and are the core of High-Performance Computing, Hybrid Cloud and Data and AI.

And just to add something to talk about in next articles, now we are coming with IBM Q to rule the Quantum world 🙂

So as I mentioned at the beginning of this article is far from being dead, it’s more alive than ever!

References

IBM Mainframe

What is a mainframe?

Mainframe Operating Systems

Mainframe: family tree and chronology

IBM Z

IBM Z Wiki

Linux on IBM Z

LinuxONE open source

z/OS

z/VM

DOS/360

IBM Power Systems Wiki

IBM Power Systems

PowerPC

IBM POWER microprocessors

Power Systems for Enterprise Linux

IBM AIX

AS/400

Versions of AIX compatible with Power Systems processors

IBM i Wiki

System to IBM i mapping

IBM i (in Power Systems)

Learn about IBM i

IBM i Community Badge Program

Timeline of virtualization

Advertisement
Posted in IBM, IBM Mainframe, IBM Power Systems, IBM Z | Tagged , , , | Leave a comment

One year and one day at IBM

It has been one year and one day since I joined IBM. It took me a while to explain to my friends and to myself why I moved to IBM. I already had great places to go. Either go back to Microsoft (glorious days), move to Contino (amazing DevOps company by the way!) or experience something different in Amazon. But out of all the sexy places I could go I decided to join the 100+ years old company.

As most of you, I thought, that IBM was all about mainframes, infrastructure services, typewriters? and consultancy services. A place where dress code was legendary for being strict and formal, forcing everyone to dress in blue suits.

On my first week I found that all that was outerly false.

A normal day in the office

Well, blue was still trendy, but that was just a coincidence 🙂

I’m not going to do some standard propaganda about how much IBM has changed for good its direction to focus on Hybrid Cloud and AI, and what it does to change the World, but I’m going to tell about my experience during one year and why I really joined IBM.

1st) People

When I was at Microsoft I met really brilliant, skilled and energetic people, that marked my whole career, but the more I spent my time in there I realised that I was mostly surrounded by product selling, marketing and business people. Don’t get me wrong, it was cool, specially working with academia and entrepreneurs. But I couldn’t find that engineering excellency I was looking for. I knew there were some interesting technical people working in the product team, but you barely saw them or were able to contact them. The secretism and protectionism was the way of living around those people and their precious products.

So the first thing i did was to look into my new family, the IBMers.
I remember listening at one of the of the managers from the Hursley Park office and tried to figure out who he was and how much he knew about technology. – I don’t know your experience, but most of the managers I met at Microsoft or other companies used to spend most of their days between Excel Sheets and Powerpoint presentations- Suddenly he started speaking about tech, trends, inventions, product evolutions and some technical details that would make you sit down on your chair and listen.

I went to LinkedIn to find the guy to find out he has 2 PhDs, had worked in CERN, has 13 pattents and is a Distinguished Engineer.

And that was the norm. Every week I met another Disginguised Engineer or Master Inventor or IBM Fellow (god-level in IBM) or Technical Eminence or WW Development Lead, I even went out for lunch with a member of the IEEE!

No special treatment, no need to go up the ladder and find out your way in, all of them were there, working around, having a coffe with you, helping and mentoring you.

2nd) Training

I used to land in a job and start delivering the very next week (or day) at 100% without even some decent induction, training or guidance.

So far my colleagues and I had 2 full months of trainings, workshops, bootcamps and more.

As per today in 366 days I have achieved 501 hours of training and 15 badges

And I still have pending 2 certification exams scheduled by the end of the year on OpenShift.

Do you want learning subscriptions? What about a full learning portal federated with Udemy, EdX, Cognitive Class, IBM Coders, Academy of Technology, Linux Technology Center, O’Really books for free, Developer Academy, Leadership Academy, Professions Academy, RedHat learning subscriptions and even special learning courses for AWS and Azure. Is that enough for you?
All moderated with a great gamification journey where you will even beg to have 8 week’s days to get extra time to go through all of it!

Education and skills are everything inside the company, everything is driven by knowledge. This company really makes you THINK

3rd) Career progression

If you are a techie and you want to be in that path your whole career, you have a full development journey just for that. If you want to model it around management, or technical specialization, or executive levels, you have that too. There are career paths, professions, roles and families for absolutely every flavour. There is that much that sometimes you feel you don’t know where to go, which is exciting and overwhelming at the same time.

4th) Fancy tech

Yes, you do have Mainframes, and Lotus Notes and DB2. But also you have cutting edge Quantum Computing, Edge Computing, Blockchain, Artificial Intelligence ( of all colours by the hand of Mr. Watson! ) , Scientific Research projects, Hybrid Cloud and more!

Then you start digging into pattents and inventions brought by IBM during the last 100+ years and it’s really jaw dropping. We are where we are mostly because what IBM has given to the world. And it keeps doing it.

Computing scale
IBM System/370 Mainframe
ITR Card Clocking-in Machine

5th) Opportunity to change the world

You start working on with team goals plus your personal goals, as most of the companies, but you have the flexibility and easiness to move sideways and contributing to other initiatives, projects and bringing your own ideas. You will always find someone that listen to those ideas and help you to develop them and make them successful.

You are not stuck in one place with one mission, the company is encouraging you to explore, think and create. You can easily find this mentality within the IBM Garage .

Everything is about learning, discovering, envisioning, developing, reasoning, operating and culture.

You have one idea, you share it with someone in your team, which shares it with someone else in other team, which spread the word to the top WW Director of that discipline which helps you to build something out of it and share it with the rest of the world. Sometimes, you just go to Slack and browse for some of the creators of a certain practice, method or technology and you get an instant and supporting response, as they are very open to talk to anyone in the company, no matters your band, expertise or experience.

Summarising, after 1 year, I thought things would be different, but 1 day after the aniversary, things are the same if not even more exciting. I would really recommend people to start or continue their careers in IBM, so THINK about that!

Posted in Uncategorized | Tagged | 5 Comments

DevOps Kitchen: How SonarQube, Azure Container Instances, Linux and VSTS work together?

Old times when Microsoft and Linux lived in parallel universes are over. Nowadays with the introduction of Cloud Services and Containers, the matter of the chosen OS is meaningless. While practising DevOps, you will find out that the technologies and tools are not the important ones, we should focus on delivering fast and with quality in a full fledged agile environment.

Today’s recipe is about how to add quality gates to our CI builds, using tools such as SonarQube, leveraging on the Microsoft Azure Container Instances.

Recipe: CI Builds with SQ and Azure Containers

Ingredients:
- 1 SonarQube Server
- 1 Azure Container Registry
- 1 Azure Container Instance
- 1 VSTS CI Build Pipeline
- 1 Ubuntu host OS
- 1 Azure CLI for Linux

Cooking time: 6 minutes


1) Creating the SonarQube server

Quickest way to create a SonarQube server instance is deploying  it from a Docker  pre-baked image, like the ones you can find in DockerHub or like in our recipe, Azure Container  Registry.

The tool chosen to deploy download the image from the ACR and create the container as an Azure Container Instance is the Azure CLI, which works under several OS platforms. For this example we are going to install the Azure CLI for Ubuntu.

Installing Azure CLI for Ubuntu:

Step 1: Copy and paste this into your Linux shell

AZ_REPO=$(lsb_release -cs)
echo "deb [arch=amd64] https://packages.microsoft.com/repos/azure-cli/ $AZ_REPO main" | \
sudo tee /etc/apt/sources.list.d/azure-cli.list
sudo apt-key adv --keyserver packages.microsoft.com --recv-keys 52E16F86FEE04B979B07E28DB02C46DF417A0893
sudo apt-get install apt-transport-https
sudo apt-get update && sudo apt-get install azure-cli

Now that we have the Azure CLI installed, let’s proceed with the container into Azure Container Instances, for that we need first to create the Azure resource group in the location we are going to host the Docker Container Instance.

Step 2: Create Azure Resource Group

az group create --name myResourceGroup1 --location westeurope

Output should be something like:

{
 "id": "/subscriptions/xxxxxx-xxxx-xxxx-xxxx-xxxxxxxxxxx/resourceGroups/myResourceGroup1",
 "location": "westeurope",
 "managedBy": null,
 "name": "myResourceGroup1",
 "properties": {
 "provisioningState": "Succeeded"
 },
 "tags": null
 }

Then, create the container, providing the name of the image in the container registry, the port to open and the public DNS name for the container.

Step 3: Create the SonarQube container in the Azure Container Instances

az container create --resource-group myResourceGroup1 --name sqcontainer --image sonarqube --dns-name-label sqmagentysdemo --ports 9000

Output should be something like:

{
 "additionalProperties": {},
 "containers": [
 {
 "additionalProperties": {},
 "command": null,
 "environmentVariables": [],
 "image": "sonarqube",
 "instanceView": null,
 "name": "sqcontainer",
 "ports": [
 {
 "additionalProperties": {},
 "port": 9000,
 "protocol": null
 }
 ],
 "resources": {
 "additionalProperties": {},
 "limits": null,
 "requests": {
 "additionalProperties": {},
 "cpu": 1.0,
 "memoryInGb": 1.5
 }
 },
 "volumeMounts": null
 }
 ],
 "id": "/subscriptions/xxxxxx-xxxx-xxxx-xxxx-xxxxxxxxx/resourceGroups/myResourceGroup1/providers/Microsoft.ContainerInstance/containerGroups/sonarqubecontainer",
 "imageRegistryCredentials": null,
 "instanceView": {
 "additionalProperties": {},
 "events": [],
 "state": "Pending"
 },
 "ipAddress": {
 "additionalProperties": {},
 "dnsNameLabel": "sqmagentysdemo",
 "fqdn": "sqmagentysdemo.westeurope.azurecontainer.io",
 "ip": "52.178.112.203",
 "ports": [
 {
 "additionalProperties": {},
 "port": 9000,
 "protocol": "TCP"
 }
 ]
 },
 "location": "westeurope",
 "name": "sqcontainer",
 "osType": "Linux",
 "provisioningState": "Creating",
 "resourceGroup": "myResourceGroup1",
 "restartPolicy": "Always",
 "tags": null,
 "type": "Microsoft.ContainerInstance/containerGroups",
 "volumes": null
 }

Step 4: Check if the container is up.

az container show --resource-group myResourceGroup1 --name sqcontainer

We also can check it in the Azure portal:

Screenshot from 2018-02-24 12-49-54

2) Integrate the SQ Container Instance as part of your  CI pipeline

Now that we have SonarQube up and running on Azure, it’s time to use it in our Builds. For this example I’m using one of my Build Definitions in VSTS (similarly works for Jenkins, TeamCity, Bamboo and others) to include 2 steps one for start the SonarQube analysis and another one to generate the summary report.

You can find the SonarQube plugin here: https://marketplace.visualstudio.com/items?itemName=SonarSource.sonarqube#overview

All you need to provide to these plugins is the URL and port of the SonarQube server and the Token generated when you finish the first time configuration.

You can see how the integration works in VSTS with our container:

VSTSCI

And how the results are displayed in SonarQube

SQResults

If you want to check the logs of the SonarQube server you can access to them from the Azure CLI:

az container logs --resource-group myResourceGroup1 --name sqcontainer

Deleting your SQ container

Eventually, if you don’t want to leave your container living forever, you can delete your container as easy as:

az container delete --resource-group myResourceGroup1 --name sonarqubecontainer


Other possible recipes:

  • Create your own Docker Container Images with SonarQube and deploy it into ACI using the Azure CLI.
  • Create the Docker Container Images from the bash or PowerShell as part of your Build steps, deploy it into ACI, use it in your pipeline and then destroy it after.

Summary

I found this solution particularly simple, as avoids you to setup your own SQ server from scratch. SQ is not going to run 24/7, you can take the container up and down any time, you don’t need a server for it, even more, the virtual machine where it is running the SQ server, can be used for multiple purposes, containers will help us to draw this isolation boundaries between this and other containers, having a better utilisation of the VM resources.

Integrating with your CI pipelines can be done easily through the plugins available in the market, either for VSTS/TFS, Bamboo, Jenkins, etc. In case you want to do your own plugin, is as easy as using the REST APIs that SQ is offering to use its quality gates even from your scripts.

Azure CLI allows you to do quick and easy operations into Azure besides you use Windows, MacOs or Linux. No need to go fancy with PowerShell or other scripting.

I hope you find your perfect recipe!

Happy baking!

References:

  • Install Azure CLI for ubuntu: https://docs.microsoft.com/en-us/cli/azure/install-azure-cli-apt?view=azure-cli-latest
  • Install Visual Studio Code: https://code.visualstudio.com/
  • Creating Azure Container Instances Quickstart: https://docs.microsoft.com/en-us/azure/container-instances/container-instances-quickstart


Posted in Uncategorized | Leave a comment

30 Days of DevOps: Choosing the right DB in AWS

Continuing with my 30 Days of DevOps experience at NTT Data Impact I came up with a couple of projects where my client was asking to move traditional SQL Server Databases to the cloud, and given that the majority of our services were living on few AWS accounts, I made a spike to show them what will be more feasible for them.

Choosing the right database is tough, as we have a lot of databases to choose from, specially when you move to the cloud. Amazon Web Services offers an amazing variety of database services, and the list and the features of each is so extent that we can get lost in information.

Before we start exploring what database technology we might use, we should ask ourselves the next questions:

  • How is our workload? Is it balanced in terms of reads and writes or is more Read-heavy or Write-heavy focused.
  • What’s the throughput we need? Will this throughput change during the day or the solution lifecycle?
  • Will we need to scale?
  • How much data are you storing and for how long?
  • Will the data grow? How big the data object will be? How the data will be accessed?
  • What’s the retention policy for your data? How often do you want to back the data up?
  • How many users will access the data? What is the response time we are expecting?
  • What’s the data model and how will it be queried? Will be structured? Does it has a schema?
  • What’s the main purpose of the DB? Is it going to be used for searches? Reporting? Analytics?

And of course, on of the most important ones, is there any license cost associated?

Once we have these questions answered, we can start exploring what database type we need.

As I said before, AWS has a big variety of Database Types:
s3

  • Relational Database Service (based on relational models) makes itself available through RDS. Within RDS you can find:
    • Amazon Aurora
    • Managed MySQL
    • MariaDB
    • PostgreSQL
    • Oracle
    • Microsoft SQL Server
  • NoSQL Database (Key-value):
    • DynamoDB and DynamoDB Accelerator
    • ElastiCache: Redis / Memcached
    • Neptune
  • Document: 
    • Amazong DocumentDB
  • Object Storage:
    • S3 (for big objects)
    • Glacier (for backups / archives)
  • Data Warehouse:
    • Redshift (OLAP)
    • Athena
  • Search:
    • ElasticSearch (fast unstructured data searches)
  • Graphs:
    • Neptune (represents data relationships)

RDS

At the contrary of what many people think, moving to RDS doesn’t mean the whole DB platform is fully managed by AWS, we have some flexibility on how we setup our services, for example with the deployment we do provision the EC2 instance sizes and the EBS volume type and size.rds

The advantages of using RDS over deploying the DB in our own EC2 are:

  • OS patching level by AWS.
  • Continuous backups and restore to specific timestamp (Point in Time Restore).
  • Monitoring dashboards
  • Read replicas for improved read performance
  • Multi AZ setup for DR
  • Maintenance windows for upgrades
  • Scaling capability (vertical and horizontal)

Let’s take as an example SQL Server.

We can select, the license model, the db engine version, the ec2 instance size, if we want Multi-AZ deployment with mirroring (Always On), the storage type, size and IOPS, network options (VPC, subnet, public or private access, availability zones, security groups) and it integrates with Windows Authentication through Active Directory.

As in Microsoft Azure, it comes with encryption, backup, monitoring, performance insights and automatic upgrades. Who said we have to go to Azure to use SQL Server?

Cost: You pay for your underlying EC2 instances and EBS volumes.

Amazon Aurora

Amazon Aurora is a MySQL- and PostgreSQL-compatible enterprise-class database. As main characteristics:

  • Up to 5 times the throughput of MySQL and 3 times the throughput of PostgreSQL
  • From 10 GB and up to 64TiB of auto-scaling SSD storage
  • Data is hosted in 6 replicas across 3 Availability Zones
  • Up to 15 Read Replicas with sub-10ms replica lag
  • Auto healing capability: automatic monitoring and failover in less than 30 seconds
  • Multi AZ, Auto Scaling Read Replicas. Also Replicas can be Global
  • Aurora database can be Global (good for DR)
  • Aurora Serverless option: here

Use case: as every other RDS service but with more performance and less maintenance.
Operations: less operations than other RDS services
Security: we take care of KMS, SGs, IAM policies, SSL enablement and authorise users.
Reliability: possibly the most reliable of all RDS, with also Serverless as an option.
Performance: 5x performance than other RDS services (also more expensive than others, except for the Enterprise grade editions like Oracle one)

MySQL

MySQL is the most popular open source database in the world. MySQL on RDS offers the rich features of the MySQL community edition with the flexibility to easily scale compute resources or storage capacity for your database.
  • Supports database size up to 64 TiB.
  • Supports General Purpose, Memory Optimized, and Burstable Performance instance classes.
  • Supports automated backup and point-in-time recovery.
  • Supports up to 5 Read Replicas per instance, within a single Region or cross-region.

MariaDB

MariaDB Community Edition is a MySQL-compatible database with strong support from the open source community, and extra features and performance optimizations.
  • Supports database size up to 64 TiB.
  • Supports General Purpose, Memory Optimized, and Burstable Performance instance classes.
  • Supports automated backup and point-in-time recovery.
  • Supports up to 5 Read Replicas per instance, within a single Region or cross-region.
  • Supports global transaction ID (GTID) and thread pooling.
  • Developed and supported by the MariaDB open source community.

PostgreSQL

PostgreSQL is a powerful, open-source object-relational database system with a strong reputation of reliability, stability, and correctness.
  • High reliability and stability in a variety of workloads.
  • Advanced features to perform in high-volume environments.
  • Vibrant open-source community that releases new features multiple times per year.
  • Supports multiple extensions that add even more functionality to the database.
  • Supports up to 5 Read Replicas per instance, within a single Region or cross-region.
  • The most Oracle-compatible open-source database.

Oracle

You do not need to purchase Oracle licenses as this has been licensed by AWS. “License Included” pricing starts at $0.04 per hour, inclusive of software, underlying hardware resources, and Amazon RDS management capabilities.

Available on different editions:

Oracle Enterprise Edition

Oracle Standard Edition: up to 32 vCPUs

Oracle Standard Edition One: up to 16 vCPUs

Oracle Standard Edition Two: up to 16 vCPUs (replacement for Standard editions)

Microsoft SQL Server

As in Oracle Databases, it supports the “License included” licensing model.

Available on the next editions:

SQL Server Express: up to 10 GiB. No licenses

SQL Server Web Edition: Only used for supporting public websites or web applications.

SQL Server Standard Edition: Supporting up to 16 GiB for data processing.

SQL Enterprise: Supports up to 128 GiB for data processing and data encryption.

NoSQL Database

ElastiCache

Amazon ElastiCache offers fully managed Redis and Memcached.elasticache

It is an In-memory data store, with an extremely good latency (sub-millisecond). As in RDS, we have to provide an EC2 instance and the cost comes with the EC2 usage per hour and the storage usage. Among its main characteristics:

  • It supports clustering (Redis) and Multi AZ, Read Replicas (sharding)
  • Security is provided through IAM policies. Despite can’t authenticate straight away, we can use Redis Auth for this purpose.
  • Backup, Snapshot and Point in time restore feature
  • Managed and Scheduled maintenance
  • Monitoring is provided through CloudWatch

Use Case: Key/Value Store. Low volume of writes, high volume of reads. Storing sessions data for websites.
Operations: same as RDS
Security: We don’t get IAM authentication, users are provided through Redis Auth
Reliability: Clustering, Multi AZ
Performance: In memory database, under millisecond performance

DynamoDB

Pure AWS NoSQL Database technology working as Serverless, provisioned capacity, auto scaling and on demand capacity.
It can serve as a replacement for ElastiCache as a key/value store, and despite we don’t get as much speed for performance as ElastiCache we don’t need to provide an EC2 instance as is Serverless and still we get between 1 and 9 ms performance on reads.dynamodb

  • It’s highly available, supports multi AZ
  • Reads and Writes are decoupled so we can balance them according to our needs.
  • We pay per Reads/Writes units.
  • Comes with DAX:  a fully-managed, highly-available, in-memory caching service for DynamoDB.
  • Integrates with SNS and DynamoDB Streams (which integrates with Lambda) that enables table changes monitoring.
  • Backup/Restore and Global Table (only with DynamoDb Streams) features
  • Has transactions capability

Use Case: Mostly on pure serverless app development and for small documents (<100Kbs).
Operations: Fully managed.
Security
: Authentication and Authorisation done through IAM, KMS encryption and SSL in transit.
Reliability: Multi AZ, Backups.
Performance: No performance degradation on scaling. DAX available for reading cache.
Cons: Only query on primary key, sort keys or indexes.
Pros: Pay per provisioned capacity and storage usage

Document

DocumentDB

Designed to store semi-structured data as documents where data is typically represented as a readable document.

  • It’s MongoDB compatible

Operations: Fully managed
Reliability: Replicates 6 copies of our data across 3 AZs. Health-checks and failover read replica in less than 30 seconds.
Performance: Millions of requests per second adding up to 15 low latency read replicas. Auto-scales up to 64 TB.
Security: VPC integration, KMS, auditing, SSL in transit.

Use case: Content management, personalisations, and mobile applications.

Object Store

S3 (Amazon Simple Storage Service) s3logo

Basically is storage for the Internet. It’s the equivalent to Blob Storage Accounts in Microsoft Azure. It does not replace RDS or NoSQL services.

It comes as S3 Standard, S3 IA, S3 One Zone IA, S3 Intelligent Tiering and Glacier (for backups).

Amazon S3 Standard is designed for high-usage data storage and can be used for website hosting, content distribution, cloud applications, mobile apps and big data.

Amazon S3 IA is designed for the data which require less frequent access. Minimum storage period is 30 days, and the minimum size of the object is 128 KB.

Amazon S3 Standard One-Zone Infrequent Access is 20% less expensive than the Standard IA and has a lower availability as only gets stored in one AZ.

Amazon Glacier is the best solution for long period storage and archiving. It hasglacier 
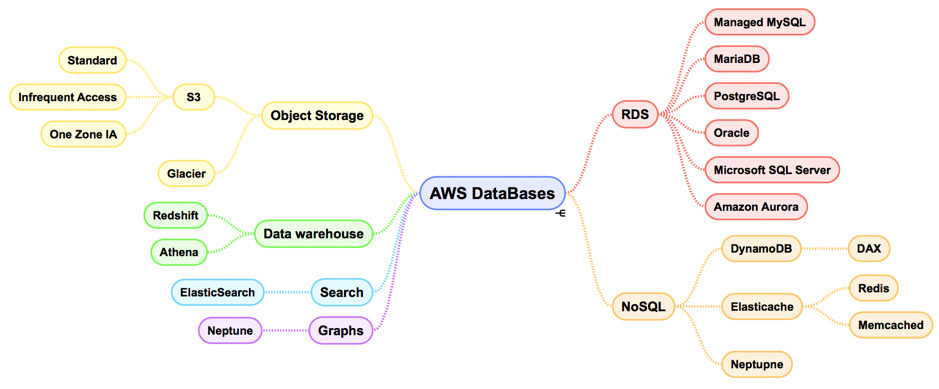
extremely low cost but the minimum period of storage is 90 days.

Star features:

  • Versioning
  • Encryption
  • Cross region replication
  • Server access logging
  • Static website hosting
  • Object-level logging
  • Lifecycle rules!
  • Object lock
  • Transfer acceleration
  • Requester pays (requester pays for the data transfer and requests instead us)

Pros:

  • Great for big objects
  • Can be used as a key/value store for objects
  • It’s serverless and scales infinitely, allowing to host objects up to 5 TB each.
  • Integrates with IAM, has bucket policies and ACL
  • Supports encryption: SSE-S3, SSE-KMS, SSE-C, client side encryption and SSL in transit.

Cons:

  • Not great for small objects
  • Data not indexed

Use Case: Static files, static website hosting and storage of big files.
Operations: fully managed
Reliability: 99.99% availability, Multi AZ and Cross Region Replication
Performance: it supports transfer acceleration with CloudFront, multi-part for big files and can scale up to thousands of read/write operations per second.
Cost: pay per storage use and number of requests.

Data Warehouse

Athena

It’s a fully serverless databe with SQL capabilities. In most of the common use cases is used to query data in S3. Basically can be considered a query engine for S3 and even athena.pngresults are sent back to S3.

Operations: fully managed
Security: IAM and S3 security for bucket policies
Reliability: same as S3
Performance: based on data size
Use Case: queries on S3 and log analytics.
Cost: Pay per query or TB of data scanned

Notes: Output results can be sent back to S3.

Redshift

It’s a fully managed, petabyte-scale data warehouse service in the cloud based on PostgreSQL. It’s OLAP, which means that is used for analytics and data warehousing.redshift

  • Scales to PBs of data.
  • Columnar storage data (instead row based).
  • Pay as you go based on the instances provisioned.
  • Has a SQL interface for running queries.
  • Data is loaded from S3, DynamoDB, DMS or other DBs.
  • Scales from 1 node to 128 nodes, up to 160GB of space per node.
  • Composed of Leader node and Compute nodes.
  • Redshift Spectrum: run queries directly against S3.

Operations:
Security:
VPC, IAM, KMS. Redshift Enhanced VPC Routing allows to copy or unload straight through the VPC.
Performance
: 10x performance than other data warehouses. MPP (Massive Parallel Query Execution).
Reliability: highly available and auto healing.
Use Case: useful to be used with BI tools such as AWS Quicksight or Tableau.

As a final point, AWS states that its costs is around 1/10th of the cost versus other data warehouse technologies.

Search

Elastic Search

Elasticsearch is a search engine based on Lucene and is developed in Java and is released as open source under the terms of the Apache License. At the contrary of DynamoDB, where you can only find an object by primary key or index, with ElasticSearch, you can query by any field that has been previously indexed, even partial matches (see use of ElasticSearch Analysers).
You can find out more about ElasticSearch capabilities in AWS in my previous articleelasticsearch.png

  • It has integrations with Amazon Kinesis Data Firehose, AWS IoT and Amazon CloudWatch Logs for data ingestion.
  • It comes with Kibana and Logstash
  • It comes with a full Rest API.

Operations: Similar to RDS.
Security: Cognito and IAM, KMS encryption, SSL and VPC.
Reliability: Multi-AZ, clustering (shards technology).
Performance: Petabytes of data.
Cost: pay per node.
Use Case: Indexing and catalog searches.

Graphs

Neptune

It’s a fully managed graph database optimised for leading graph query languages. . The core of Neptune is a purpose-built, high-performance graph database engine optimised for storing billions of relationships and querying the graph with milliseconds latency.

  • Highly available across 3 AZ with up to 15 read replicas
  • Point-in-time recovery, continuous backup to Amazon S3
  • Support for KMS encryption at rest and SSL in transit.
  • Supports Open Graph APIs
  • Supports network Isolation (VPC)
  • It can query billions of relationships in milliseconds.
  • Can be used with Gremlin and SPARQL.

neptune

Security: IAM, VPC, KMS, SSL and IAM Authentication.
Performance: best suited for graphs, clustering to improve performance.
Use Case: Social networking, knowledge graphs, detect network event and anomalies.

In most of my projects at NTT Data Impact we end up recommending the usage of Serverless platforms in AWS, that’s one of the reasons why S3 is a key component in most of our solutions, I really recommend to take a look into its capabilities.

I hope that this short guide helps you to decide what Database service is more adequate to your needs. Also take in consideration all the main questions at the beginning of this article, as sometimes, we tend to think short term and we end up regretting our decisions after a while 🙂


Posted in AWS, cloud, Uncategorized | Tagged , , | Leave a comment

30 Days of DevOps : Gitflow vs Github flow

Deciding what’s the right branching strategy can always be painful. From it, depends not only how your source code is being merged and maintained, but also how software is going to be built, tested, released and how hotfixes and patches are going to be applied.

Some teams go very ambitious and they start creating branches for everything: development, features, epics, releases, test, hotfixes and more.

The problem of this is not about the number of branches you use if as the team is disciplined enough and follows the agreed practices. The problem comes when the team changes quite often letting some practices to get missed or its not “forced” or “controlled” to follow those practices.

Some clear symptoms of bad branching management are:

• branches named out of the standards defined
• developers assigning their names to branches
• branches that can’t be tracked down to the user story were they belong to
• your main or development branch are behind the release branch
• the team is not branching out from the main or development branch when creating new features
• the production code is residing in a private branch
• the team has a branch per environment
• the branch name has a very long description such as: development-for-kafka-streams-api-october-work
• every time the team merges into development branch it takes hours if not days to resolve conflicts
• nobody knows exactly where the latest version of the code is

Some of these issues can be solved enforcing some branching rules in the Version Control Manager. We can protect the master branch from further commits unless these come from a pull request. At NTT Data we work a lot with Bitbucket, as it is one of the most popular Version Control Repositories based on GIT among our projects. Let’s check how this looks like on Bitbucket:

Blog_BB2.png

We can use prefixes on the feature branches by default so developers just have indicate the number of the user story that is related to.

Blog_BB1.png

Most of the VCMs nowadays have these options so, let’s talk now about branching strategy as having Source Code Version Control is kind of useless if you don’t have a proper branching strategy in your team.

Just Master

The simplest one is you have just a master branch and then create a feature branch every time we need to develop a new feature. Then we commit the code inside that private branch and when the code is tested and ready for release we merge it into the master branch through a pull request and after the approval from the reviewers.

At the end of the iteration the code is released into master.

initial branch diagram

Release Branches

Similar branching strategy is to have 2 branches, one for development and the other one for release, so then we can use the release branch for hosting the production code through proper labelling and we can create hotfixes from it.
At the same time, we are reducing the number of commits into the master branch, having a cleaner history.Version 1.0 is released

Environments branches

Another approach to release branches is environment branches. With this model we are bringing visibility to what’s deployed on each environment, facilitating rollbacks and development of hot-fixes on the spot.

Untitled Diagram.png

Feature branches

I’m a big fan of feature branches, as soon as they are short living, as they can be very noisy, specially if we treat feature branches as user stories on our sprint. But in other hand can be very useful to isolate features and for testing them independently. One of the downsides is that the integration can be painful, but you can always opt for techniques such as feature toggling on your production version (main).

Basic feature isolation

Feature isolation noise

Gitflow

The overall flow of Gitflow is:

  1. A develop branch is created from master
  2. A release branch is created from develop
  3. Feature branches are created from develop
  4. When a feature is complete it is merged into the develop branch
  5. When the release branch is done it is merged into developand master
  6. If an issue in master is detected a hotfix branch is created from master
  7. Once the hotfix is complete it is merged to both developand master

Blog_gitflow.png

This model can be quite complex to understand and to manage, specially if the branches are living too long or if we are not refreshing our branches periodically or when needed.
Also as you can appreciate, master = production, which means is the main player here. Hotfixes are branched off from master and merged back into master.
Develop is merged into a release branch which eventually is used for release prep and wrap up and then merged into master.

In the end, master contains the releasable version of your code, where should be tagged properly, and the number of branches we have behind it, despite they can be overwhelming, help us to move the code through the different stages of the software development so we can refine it and debug it in a more sequential manner than with GitHub Flow.

The downside of this is that the team can struggle with too many branches and it has to be very disciplined when using Gitflow as they can easily lost track of the code state, have branches way behind master, merging can be a nightmare sometimes and you can end up easily with a list of 50 branches open at different stages of development which can make the situation unmanageable.

Github flow:

One of the favourite branching strategies by the developer community is the Github flow approach. This approach it looks simple but it is difficult to achieve if you want to get the maximum potential out of it.

Within this branching model, the code in the master branch is always in deployable state, it means that any commit into the master branch represents a fully functional product.

The basic steps are:

  1. Create a branch
  2. Add commits
  3. Open a pull request
  4. Discuss and review the code
  5. Deploy into production environments (or others) for testing
  6. Merge into master

Blog_Githubflow.png

The recommendations using this model are:

  • Try to minimise the number of branches
  • Predict release dependencies
  • Do merges regularly
  • Think about the impact of the choice of repository
  • Coordinate changes of shared components

One thing that we should do to ensure the code is master is always in deployable state is to run the pertinent functional or non functional tests at the branch level, before we merge into master. With this we can ensure that the quality of the code that goes into master is always good and is fully tested.

Some teams follow this to the point of even deploy into production straight from the feature branch, before the merge happens and after the tests have passed and, if something goes wrong, rollback deploying the code that is in the master branch again.

This model is basically encouraging Continuous Delivery.

Summary

After many years and many types of projects (apps, websites, databases, AI, infrastructure, dashboards, etc), I have come with three advices:

a) Analyse how the development team work and come with a model that adapts to them and not the opposite. I have seen many teams being forced to use GitFlow, and then spend months trying to fix the chaos created in the repo as they quite didn’t understand it or didn’t adapt to the way the release code.

b) Keep it simple and work with the team to become more mature and agile when releasing software. There is nothing wrong with starting a project just with a master branch and deal with that for a while until the team feels confident enough to start working with multiple branches. If they are scared about working straight against a master branch, just create a basic model of development-master branches and just do merges all together once in a sprint into master so the team can review the whole process.

Believe or not, there are many teams out there that still don’t work with branching or git! So introducing a full GitFlow concept for the first time to these teams can be overwhelming.

c) If after few sprints, you feel the model you use it’s not working for you try something different, don’t be shy. In our DevOps Squad at NTT Data we do DevOps Assessments where we also define and implement with you the branching strategy that could fit better to your team given the nature of your projects and your way of working.

If you ask me for my favourite, GitHub flow is the one. But it requires a good level of maturity when it comes to quality control and you have to make sure that all the environments and testing are ready and can be triggered at branch level, which requires some degree of automation.

In one of the projects I have recently worked on at NTT Data, we used to capture the Pull Request from Bitbucket with a hook in Jenkins, then build the code, deploy dynamically and environment on Azure using Terraform and Ansible, then run functional and non functional tests and if the build/deploy pipeline is green, then merge and close the Pull request.

There is a nice integration between Bitbucket and other DevOps tools that can help you to achieve this level of automation and branching strategy.

I hope you come up with the right one for you!

Happy branching.


References:

Feature isolation: https://docs.microsoft.com/en-us/azure/devops/articles/effective-feature-isolation-on-tfvc?view=vsts

Github flow: https://guides.github.com/introduction/flow/

Bitbucket and NTT Data: https://uk.nttdata.com/News/2019/03/NTT-DATA-UK-Becomes-Atlassian-Gold-Partner

Posted in Atlassian, DevOps, GIT | Leave a comment

30 Days of DevOps: Azure resources, environments and Terraform

Managing Azure Resources is a piece of cake, isn’t it? Just log into the Azure portal, select or create a resource group and begin administering your resources. Quite straightforward, right?

Blog-AzurePortal1
But, let’s say we have a case where we have to have 9 Windows 2016 Servers installed for a new team of developers that are joining the team next week and 5 Test Agents to be hosted on different versions of Windows with multiple browsers installed, which developers and testers will use to run their UI tests remotely.

Our 1st challenge is how we can provide all this infrastructure and applications on such short notice?

2nd challenge is about test environments. We are going to be running UI tests, which tend to leave residual test data in our browsers and disks, such as cached data.

There could potentially be a 3rd challenge if we have to use PowerShell for provisioning the machines and an Apple computer.

Let’s tackle one issue at a time…

1st. Provisioning and managing resources

As I said previously, you can create and manage all the resources from the Azure portal, but this is a manual step, which once done (a process that can take minutes), the only way to track of what has been deployed is the Activity Log. The rest of the info can be extracted from the service plan or sku (if any) or the properties of the resource.

Blog_AzurePortal2

A more elegant and cost-efficient way to manage and deploy your resource catalogue is using Terraform.

Terraform can help us create our deployment plans and keep track of what’s being deployed, deploy a given resource just applying the plan, destroy the resource in a click and redeploy it again with another click.

For most of the resource’s properties, we can go to our terraform file to change the property we want and then re-apply the changes. If it requires a full rebuild of the resource, Terraform will tell us and will then do this for us.

In the case of our 9 Windows Server machines, we just need one terraform template for designing the machine specs, network, security, OS image and disk and then to create one property variable file per machine.

Blog_Terraform1.png

Same applies for the 5 test agents in our scenario.

With Terraform we can manage not only VMs but Data Sources, App Services, Authorization, Azure AD, Application Insights, Containers, Databases, DNS resources, Load Balancers and much more!

Some of you may think to use ARM templates but I personally find them full of clutter and too complex when compared with the simplicity of Terraform.

Blog_ARM1.png

(example of 1 machine exported to ARM template. More than 800 lines of script!)

2nd. Test Environments

Test environments are expensive. Microsoft offers something called Dev/Test Labs, where you can quickly deploy test environments and schedule them to go up and down according to your needs. But this is not enough, we want to create the test environment, deploy the test agent, provisioning it with the configuration we need, run the tests and then destroy the environment.

I’m not going to dive into the configuration provisioning or test runs in the deployment pipeline as I will leave it for a separate post, but it is worthwhile to mention the continuous deployment of environments.

If we already have a template to create the Azure resources we just need to activate it with a button. This can be triggered just with a job that can be hosted on Azure Pipelines, Jenkins, Team City, Octopus Deploy or similar deployment pipeline orchestrators.

Such deployment could be fully automated without requiring pre-approval or we can use the deploy button on demand.

The main point for discussion is not the tool but the process, and we have already started the process abstracting the infrastructure into Terraform. Now, it’s just about applying our plans on demand. It could be as simple as:

terraform apply -var-file=MachineX.tfvars

For those who are more adventurous and don’t want to use terraform they can use ARM templates which can be used in your CD pipelines or even, if you fancy it, create your own Azure Function that runs a PowerShell script that deploys your infrastructure.

3rd. Azure from Mac

Most people associate Azure with Windows and AWS with Linux, well, that’s a myth.
You can manage Azure from macOS, Windows, Linux or others, but here are some recommended tools to manage your Azure Resources.

Option 1. Install and use Azure CLI.
The Azure CLI is Microsoft’s cross-platform command-line experience for managing Azure resources.

Option 2. Azure Portal: https://portal.azure.com.

Azure portal not only offers you a nice GUI to deploy and maintain your resources, but it also gives you a remote Bash or Powershell! Just open your portal and click on the top bar in the icon >_

Blog-ScriptingCloud

Option 3. Powershell and Powershell core.

PowerShell Core is a version of PowerShell that can run in any platform and that is based on .NET Core, and not .NET like his predecessor PowerShell. If you are currently using Windows 10 you can use out of the box PowerShell 5.1, and this latest version of PowerShell Core v6.0. Otherwise, you can use PSCore in your Mac.

Once you have PowerShell Core on your Mac or Linux distro, you can install the modules for Azure

Option 4. Terraform.
Avoid the portal, scripting with PowerShell or even managing Azure from your APIs. Just try out Terraform and manage your resources from only one place.

I hope you have enough to start managing your Azure resources and find out what is the best way for you to deploy all those machines with no effort.

Enjoy it!

Posted in Azure, DevOps, Terraform, Uncategorized | Leave a comment

30 Days of DevOps: Elastic cloud vs AWS PaaS ELK

Some time ago I read an interesting article titled: “Is It the Same as Amazon’s Elasticsearch Service?

It was quite a good article, to be honest, it compared perfectly 2 great elastic implementations: Elastic cloud from Elastic.co and Elasticsearch services from AWS.
Nevertheless, I thought the article was not fully objective, as it was mostly saying that AWS implementation was an Elastic Search fork of the Elastic Search mainstream and that was lacking all the capabilities that now Elastic cloud offers in the X-Pack package, This is amazing but costs a pretty penny!

In the end, both should be the same right? As Elasticsearch is a search engine based on Lucene and is developed in Java and is released as open source under the terms of the Apache License.

So both are offering the same product but with small differences, one is offering a ton of plugins provided by X-Pack, the other is relying on the current AWS services to match his rival.

At MagenTys I have worked with both and also with the On-Premises version of ELK, but I want to give you my opinion. Let’s take a closer look at both and also analyse a vital part of it, which is the cost.

Elastic Cloud

It’s the company behind the Elastic stack, that means Elasticsearch, Kibana, Beats, and Logstash.

They officially support the Elasticsearch open source project, and at the same time offers a nice top layer of services around it, this is formerly known as X-Pack.

X-Pack is made of enterprise-grade security and developer-friendly APIs to machine learning, and graph analytics.This includes security, alerts, reporting, graph, machinelearning, Elasticsearch SQL and others.

It has a very nice cost calculator: https://cloud.elastic.co/pricing

Which we will be using for this article in order to compare it with AWS offering. For such purpose we will be comparing a t2.medium AWS instance.

Elasticsearch service AWS 
Instance type Two instances:
– aws.data.highcpu.m5
– aws.kibana.r4
Instance count 2
 Dedicated master  No
 Zone awareness  No
 ES data memory  4 GB
 ES data storage  120 GB
Kibana memory  1 GB
Estimated price: $78.55
As we can see, Kibana and Elastic are deployed in separate instances and the total storage is 120 GB, which is quite good in comparison with what comes by default with AWS (35GB).
Thanks to X-Pack we will enjoy of a few new features from either Kibana, ES or Logstash. Main plugins are:
– Graph
– Machine Learning
– Monitoring
– Reporting
– Security
– Watcher
More information here
Blog-Kibana1

Elasticsearch service AWS

Another alternative is Amazon Elasticsearch service, which is a fully managed service by AWS. This means it’s fully deployed, secured and ready to scale Elasticsearch.

It also allows us to ingest, search, analyse and visualise data in real-time. It offers Kibana access as well, and LogStash integration, but it lacks of the X-Pack, this means that some of the previous features we’ve seen such us users and group management and alerts are missing. This could be tackled with a different approach, letting AWS to manage the access to ES and Kibana using the “access policy” where we can whitelist ip addresses and apply access templates to IAM users. Also offers integration with Amazon Cognito for SSO and Amazon CloudWatch for monitoring and alerts.

Another advantage is that can be integrated in your VPCs.

Let’s take a look to the pricing:

Elasticsearch service AWS 
Instance type t2.medium.elasticsearch (2vCPU, 4GB)
Instance count 1
Dedicated master No
Zone awareness No
Storage type EBS
EBS volume type General Purpose (SSD)
EBS volume size 35 GB
Estimated price: $59.37

$0 per GB-month of general purpose provisioned storage – EUW2 under monthly free tier 10 GB-Mo – $0.00

$0.077 per t2.medium.elasticsearch instance hour (or partial hour) – EUW2 -720 Hrs – $55.44

$0.157 per GB-month of general purpose provisioned storage – EUW2 – 25.000 GB-Mo – $3.93

You need to pay standard AWS data transfer charges for the data transferred in and out of Amazon Elasticsearch Service. You will not be charged for the data transfer between nodes within your Amazon Elasticsearch Service domain.
Amazon Elasticsearch Service allows you to add data durability through automated and manual snapshots of your cluster. The service provides storage space for automated snapshots free of charge for each Amazon Elasticsearch domain and retains these snapshots for a period of 14 days. Manual snapshots are stored in Amazon S3 and incur standard Amazon S3 usage charges. Data transfer for using the snapshots is free of charge.
Data transfer costs in AWS are quite small but also we have to take them into consideration.
Data Transfer OUT From Amazon EC2 To Internet
Up to 1 GB / Month $0.00 per GB
Next 9.999 TB / Month $0.09 per GB
Next 40 TB / Month $0.085 per GB
Next 100 TB / Month $0.07 per GB
Greater than 150 TB / Month $0.05 per GB
And last but not least, as X-Pack is not available, the plugins we discussed about before are not present.
Blog-Kibana3

Summarising

If you compare the costs, there is really not much difference between one and the other, but some extra work to setup properly the AWS implementation needs to be taken in consideration. In Elasticcloud some stuff comes out of the box, and despite requires some tricky configuration (such alerts), in AWS we have to build this from scratch using CloudWatch, events and alerts, so we will spend the money on a consultant that can take of it.

Snapshots is another big point of discussion, as in Elasticcloud snapshots are taking daily 48 times per day every 30 minutes and get stored for 48 hours, while in AWS snapshots are being taken once a day and retained for 14 days with no cost too.

I hope this article helps you to decide which one is your best fit, and do not forget that you can also go for another path, which is create your own ELK stack on premise or in your Cloud, from scratch, deploying it straight into your EC2 instances or Containers hosts and manage fully the infrastructure, services and applications.
Happy searching!
Posted in DevOps, ELK, Uncategorized | 1 Comment

30 Days of DevOps: Test Automation and Azure DevOps

Coding best practices are becoming the norm. More and more development teams are acquiring habits during their developments such as TDD and even BDD. Despite this meaning having to shift left completely the testing, it’s something that for some teams still take years to digest, so we have to go step by step, and the first one is to enable visibility.

Just having TDD and BDD properly applied, doesn’t mean that we are enabling full test automation in our project. Automation is not just about having my code covered by tests and defining features and scenarios on Gherkin in conjunction with some frameworks such as Cucumber, Specflow or Cinammon triggered by some build jobs. It’s also about automating the results, and enabling traceability and transparency when the release happens.

One thing that is not quite often used in Azure DevOps (formerly VSTS), is the Test Automation traceability.

First, let’s talk about test results and where you can find them…

  1. Track the report of my unit tests/component tests running on my build.
    That can be done from a few places one is the Build status report:
    BlogVSTS_Test1.png
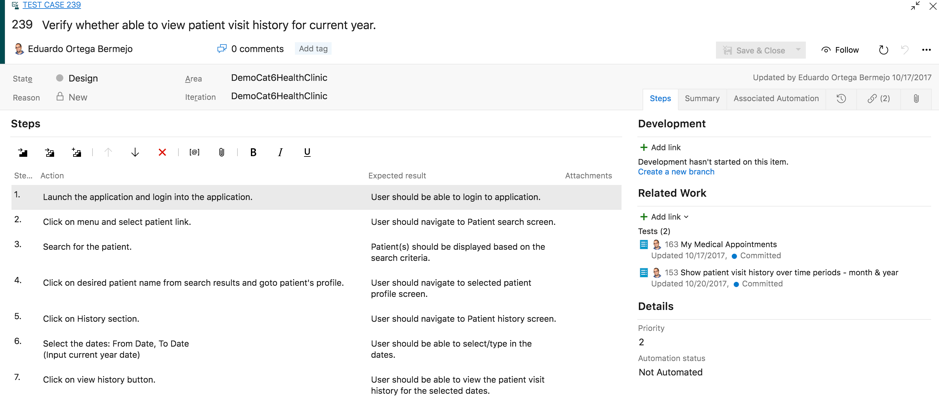
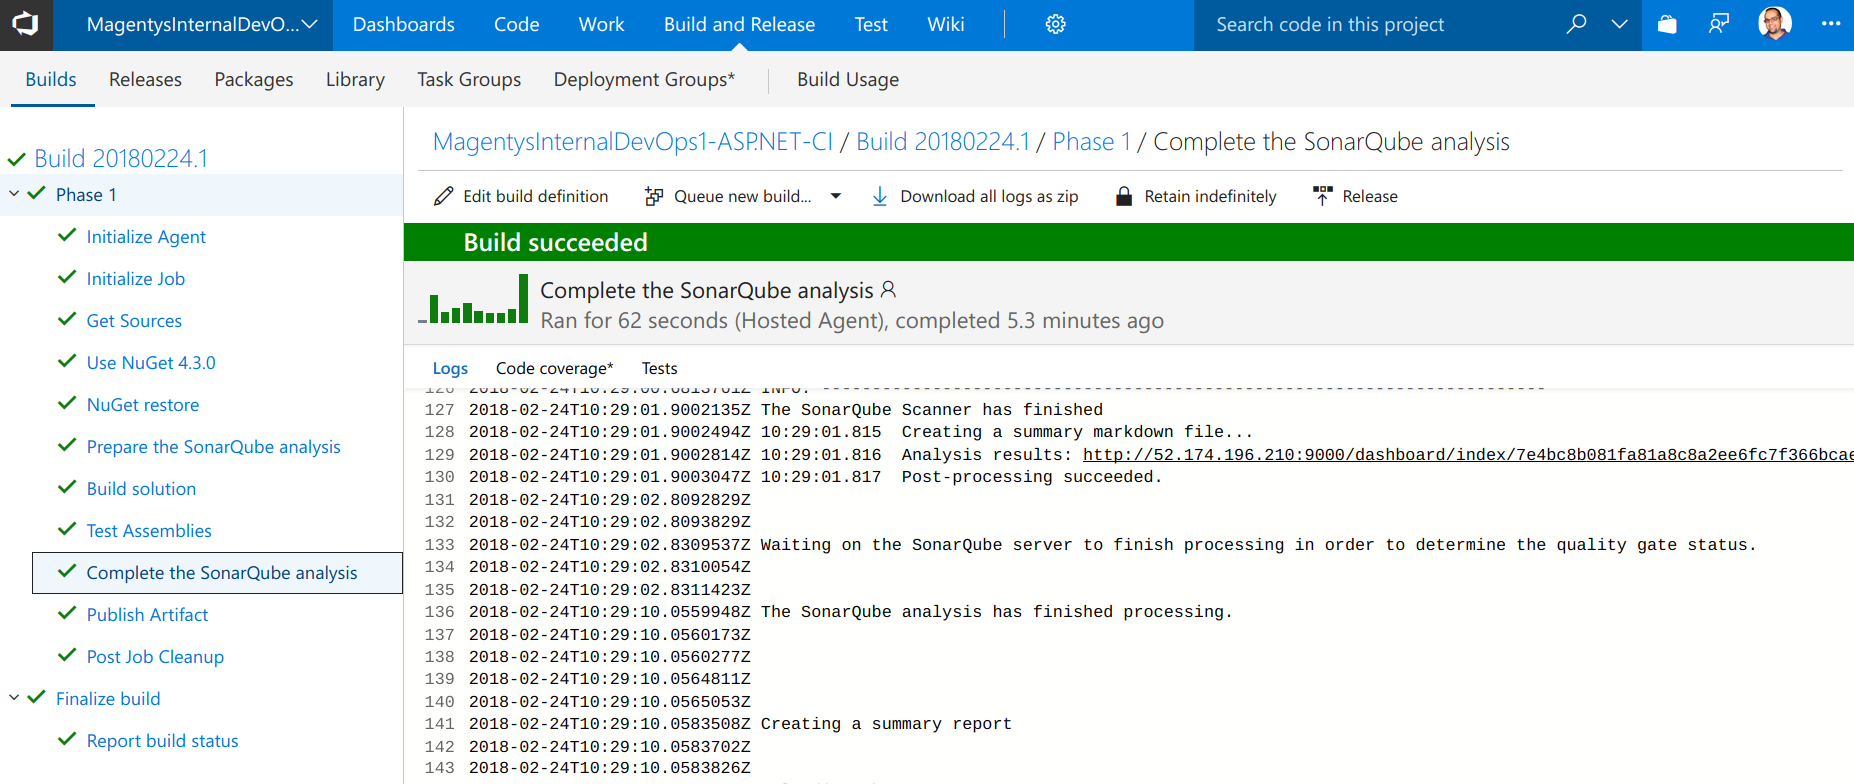
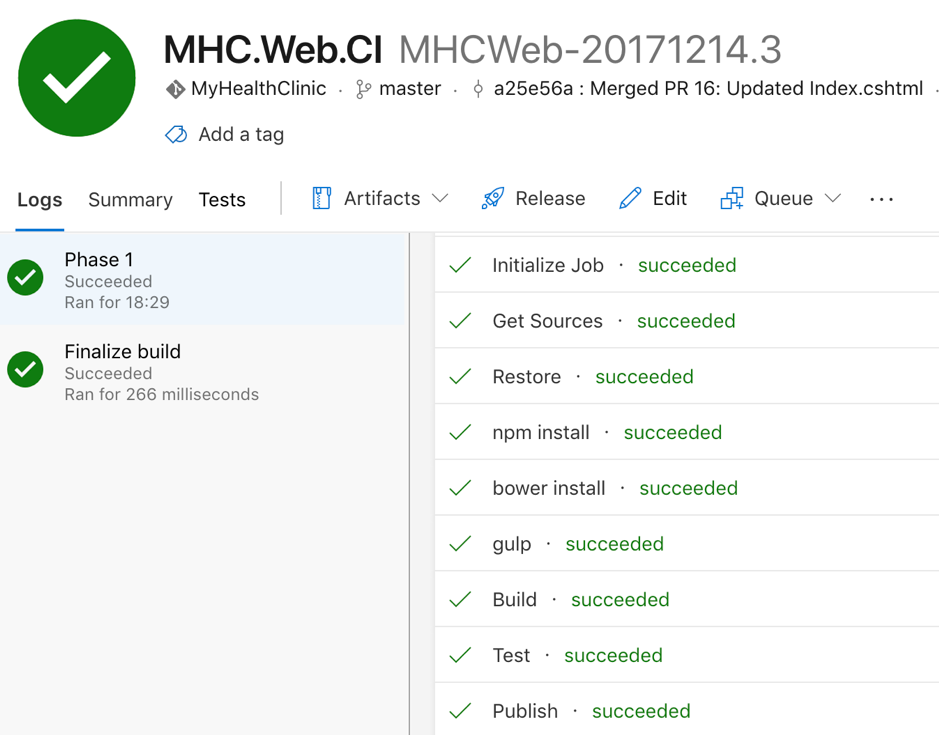
The other one is the Tests Tab:
    Blog-VSTSTest2
  2. Using the new Analytics tab in the Build main page. For that, first, we have to install the Analytics plugin which appears the first time we access to analytics.
    Blog-VSTSAnalytics
    Once installed we can have a more granular detail of our test failures
    Test analytics detail view
    Group by test filesMore information here 
  3. Every test run, of any kind, is registered on the TEST section of Azure DevOps. For accessing this section you need to have or either a Visual Studio Enterprise subscription associated with your account or a Test Manager Extension, which also offers you much more than just test reports.Blog-VSTS-Runs

I really recommend using Microsoft Test Manager / Test Extensions in conjunction with Azure DevOps to get the full potential of test reports and test automation.

Second, on traceability we are not just linking our test runs to the builds, we want also to go a step further and link our test cases to user stories. This part is easy, right?

We just have to create a test case and link it to our user story. This can be done manually from our workspace or it can be done from Microsoft Test Manager when we create test cases as part of Requirements.

At the end this would look like this inside the user story (displayed as Tested By):

VSTS_TestCasesInStory.png

You can find more information here about how to trace test requirements

Third. This leads me to the last part which is my test automation. When you open a test case it usually looks like this:

VSTS-TestCase1

But this is a test case that can either be created as a manual test or automatically through an exploratory test session (one of the cool features of MTM). The good thing of them is that if they are properly recorded, you can replay them again and again automatically using one feature called fast forwarding.

Our need is to link our coded test automation (MSTest, NUnit, etc) to these test cases, that why Microsoft gave us that “Automation status” tab inside our test cases.
This tab is just telling us if it has an automation test associated with the test case or not.
An easy and quick way to enable this is:

  1. Go to Visual Studio Test Explorer
  2. Right-click over your test
  3. Associate to a test caseAssociate Automation With Test Case

Sometimes we don’t need to go through test cases, we just want to set up a test plan and run all the automation against that test plan. With this, we don’t have to create our Test Cases in Azure DevOps, we just need to create a test plan, configure its settings and modify our test tasks in build/release pipelines to run against that plan.

There is a good article from Microsoft that explains the whole process here.

Last but not least, I want to write briefly about Microsoft Test Manager. This tool has been around since the early versions of Visual Studio with Test Edition and with the Premium/Enterprise editions.

Initially, it was meant to be used as a Test Management tool for manual testing and exploratory testing, but it has acquired more capabilities over the years, up to the point that today it’s mostly integrated with Azure DevOps inside the TEST tab.

If you have the MTM client, you can connect to your Azure DevOps project and manage from there your test cases, test environments, manual tests, exploratory test sessions and you can also record not only your sessions but your test steps too through exploratory sessions. With this, you can run most of your manual tests automatically using fast forwarding, which replays all the actions the tester takes.

It is REALLY good for managing test suites and test packs and it has integration with your Builds and Releases, and you can even tag the environments you are using and the software installed on them.

This adds to your Test Capabilities what you need in order to complete your plan.
As a last note, if you are using Coded UI as your main UI Test Automation Framework, it has direct integration with MTM too, so you can associate your Coded UI tests to your Test Cases.

There is also one forgotten feature called Test Impact Analysis, which integrates not only with your builds and releases but also with MTM, which allows you to re-run only the tests that have been impacted by code changes since the last time the code was pushed into the repository, so then we save testing time.

I hope this article shows you the capabilities of Azure DevOps in terms of Automation and Traceability.


References:

Associate automated test with test cases

Run automated tests from test plans

Workarounds: Associate test methods to test cases

Track test results

Analytics extension

Test manager

Test Impact Analysis in Visual Studio

Code coverage in Azure DevOps and Visual Studio

Track test status

Posted in Build, Coded UI, DevOps, Testing, Visual Studio | Leave a comment

30 days of DevOps: Application Logging

How do you analyse the behaviour of your application or services during development or when moving the code to production?

This is one of the most challenging things to control when we deploy software into an environment. Yes, the deployment is successful, but is the application really working as expected?

There are a number of ways to check if it is working as expected. One way is to analyse the behaviour of your application by extracting the component and transaction logs generated internally and somehow analyse them through queries and dashboards, This should help us to understand what’s going on.

SPLUNK

I’m a big fan of Splunk, you just need to create your log files and send them to Splunk, and in a matter of minutes, you can create shiny cute dashboards to query and monitor your log events.

Blog_Splunk

My only issue with Splunk is the cost. Using it for a few solutions is okay, but when you’re having to process a large amount of data it then becomes very expensive. As the offering we might need is based on a set of data per day. Even so, I can say it’s extremely easy to parse your data, create data models, create panes and dashboards and also provide alerts.

Some teams may rather opt for other (cheaper) solutions. Remember, open source doesn’t always mean free. The time your dev team is going to spend implementing the solution is not free!

ELK

A cheaper (sometimes) alternative is to use Elastic Search and Kibana (for extracting logs and analysis in that order).

Kibana is an open source data visualization plugin for Elasticsearch. It provides visualization capabilities on top of the content indexed on an Elasticsearch cluster, which is also open source.

Both can be hosted on your own servers, deployed on AWS or Azure or another cloud provider and you even have the option to use a hosted Elastic Cloud if you don’t care too much about the infrastructure.

How does this work?

1st) log your operations with a proper log management process (unique log code, log message, severity, etc).

2nd) Ingest the log files into an elastic search index and extract from your events the fields that you want to use for your charts representation and searches.

3rd) Create searches and dashboards according to the needs of the team. E.g. All logs, error logs and transactions for Dev and Test, error logs per component per system, no. Of HTTP requests, and HTTP error codes for Business Analysis, Operations and Support, etc.

4th) Give to the team the access and tools they really need. Yes, you can provide access to Kibana to the whole team and everybody’s happy, but why not use the full potential of Elastic Search? If I would be doing the testing, I would use the Elastic Search REST API to query the events logged by the application from my tests.

At MagenTys we have done ELK implementations from Zero to Hero for a wide range of projects, and not only for software development. It can also be used to ingest and represent the data of sources, such as Jenkins, Jira, Confluence, SonarQube and more!


Don’t like ELK? There are other options for application logging, that can be also extended to your infrastructure, like Azure Monitor.

Azure Monitor

Microsoft has recently changed the names to some of their products and has also grouped them all together. For example, Log Analytics and Application Insights have been consolidated into Azure Monitor to provide a single integrated experience.

Azure Monitor can collect data from a variety of sources. You can think of monitoring data for your applications in tiers ranging from your application, any operating and services it relies on, down to the platform itself

OMS (Operations Management Suite) as such is being retired, moving all its services into Azure Monitor. For those that are currently using it, you should know that by Jan 2019, the transition will be complete and you might have to move into Azure Monitor

Saying that, the new Azure Monitor experience looks like this:

Azure Monitor overview

Azure Monitor collects data from each of the following tiers:

  • Application monitoring data
  • Guest OS monitoring data
  • Azure resource monitoring data
  • Azure subscription monitoring data
  • Azure tenant monitoring data

To compare it with Splunk and ELK, we can leave the operations and resources monitoring aside for a moment and focus on Log Analytics and Application Insights.

Log data collected by Azure Monitor is stored in Log Analytics which collects telemetry and other data from a variety of sources and provides a query language for advanced analytics.

Common sources of data usually are .NET and .NET Core applications, Node.js applications, Java applications and Mobile Apps. But we can import and analyse custom logs too.

There are different ways to use Log Analytics, but mostly is being done through Log Queries:

Log searches


Remember that with Log Analytics and Log Queries, we are extracting the events created in our log files, organising and parsing them, filtering and then creating our Dashboards, Reports and Alert from them, similar to the Splunk model. With the advantage that we can cross-reference this logs with the information extracted from Application Insights:

Tables

Application Insights (which used to be separated from OMS and Log Analytics), is better used for analysing the traffic and actions around your applications. For example, on a web page, it’s straightforward with Application Insights to see the number of web requests, the pageViews, the HTTP Error codes or even analyse the stack trace of the errors captured and link this to our source code.

On the visualisation side,

Dashboard

It still has some limitations in terms of customisation of visualisations, but it’s extensible as we can link it to wonderful tools such as PowerBi or Grafana.

Azure Monitor views allow you to create custom visualizations with log data stored in Log Analytics.

View

Application Insight workbooks, provides deep insights into your data, to help your development team to focus on the most important.

Workbook

Last but not least, you can use Log Analytics in conjunction with PowerBi or Grafana, which are “nice to have”. The problem of Grafana is that you can monitor and build metrics but not analyse logs:

Grafana

The bright side is that Grafana is Open Source, free and can be used with many many data sources, Elastic Search included.

The last thing to mention, Azure Monitor it’s not free but it’s quite affordable!

In Summary

We have briefly discussed Splunk, ELK and Azure Monitor. What type of data we can extract and analyse, different visualisations, and cost.

Most development teams use ELK as they are used to it or either come from a Java background.

I’m seeing more and more teams using Splunk, which I really recommend but it is still an expensive tool to have.

Azure Monitor, traditionally has been used extensively in Operations (a legacy from System Center family, moved to the cloud, now integrated with other analytic tools) and Performance Testing. Now they bring together the other missing piece, Log Analytics and Application Insights, for application logs analysis, and offers a very good combo of metrics and logs tools for a very good price.

Not to go into deep details about any of those, just mentioning the most common scenarios I’m finding out there.

I hope this information is useful for you!


Posted in Uncategorized | Leave a comment

30 days of DevOps: Jenkins and Jira

Another DevOps day at MagenTys.

Part of DevOps is to increase transparency and improve the end 2 end traceability of our user stories from the conception to the release out of the pipeline.

There are different ways to bring that in. One typical case is how we can track development activities inside our Jira tickets.

Jira has integration with multiple development tools and external systems. For example, we can have our source code in Github or Bitbucket and track any source code changes and the pull requests and branches created in our repo, all of it from inside the Jira ticket.

Blog_JiraBranching

This helps the team to know what changes were made in the code for the purpose of this story.

But, despite this being a cool must-have, we can go one step further and also manage our build pipelines from our beloved Atlassian tool. We can, for example, trigger a Jenkins job every time a pull request is completed.

Blog_Bitbucket

So the team can create the pull request from Jira,  another team approves it and merge the code and then a Jenkins hook captures the commit and triggers the job.

At this point, you can think, “wow, that’s awesome!”. But hold your horses, it can be improved, even further, what about updating the ticket status back in Jira whenever the build fails or succeed? Now is where it gets fancy.

We can use Jenkins to call the Jira API to change the status of the ticket according to build job that is building the branch associated with the ticket, so now we don’t only have automatic builds from Jira/Bitbucket but also we can have Jenkins reporting to Jira what’s going on with the builds, which packages are created in Nexus or Artifactory.

For that, we can either use one of the many plugins available for Jenkins or call the Jira REST API from a Jenkins job task.

Jira Plugin
Jira Issue Updater Plugin

You can find some plugins in the Atlassian Marketplace too so you can do something fancy as the plugin below:

Image result for jira jenkins integration

https://marketplace.atlassian.com/apps/1211376/jenkins-integration-for-jira?hosting=cloud&tab=overview

Thanks to this you can improve our code, build, test, release process and making the life easier for every development team member, and at the same time helping to generate the release page in confluence with the right stories, artefacts, and qualities signed off, but that’s another DevOps story for another day.


References:

Bitbucket configuration: https://wiki.jenkins.io/plugins

Atlassian marketplace: https://marketplace.atlassian.com

Posted in Atlassian, DevOps, Jenkins, Uncategorized | Leave a comment