
How do you analyse the behaviour of your application or services during development or when moving the code to production?
This is one of the most challenging things to control when we deploy software into an environment. Yes, the deployment is successful, but is the application really working as expected?
There are a number of ways to check if it is working as expected. One way is to analyse the behaviour of your application by extracting the component and transaction logs generated internally and somehow analyse them through queries and dashboards, This should help us to understand what’s going on.
SPLUNK
I’m a big fan of Splunk, you just need to create your log files and send them to Splunk, and in a matter of minutes, you can create shiny cute dashboards to query and monitor your log events.
My only issue with Splunk is the cost. Using it for a few solutions is okay, but when you’re having to process a large amount of data it then becomes very expensive. As the offering we might need is based on a set of data per day. Even so, I can say it’s extremely easy to parse your data, create data models, create panes and dashboards and also provide alerts.
Some teams may rather opt for other (cheaper) solutions. Remember, open source doesn’t always mean free. The time your dev team is going to spend implementing the solution is not free!
ELK
A cheaper (sometimes) alternative is to use Elastic Search and Kibana (for extracting logs and analysis in that order).
Kibana is an open source data visualization plugin for Elasticsearch. It provides visualization capabilities on top of the content indexed on an Elasticsearch cluster, which is also open source.
Both can be hosted on your own servers, deployed on AWS or Azure or another cloud provider and you even have the option to use a hosted Elastic Cloud if you don’t care too much about the infrastructure.
How does this work?
1st) log your operations with a proper log management process (unique log code, log message, severity, etc).
2nd) Ingest the log files into an elastic search index and extract from your events the fields that you want to use for your charts representation and searches.
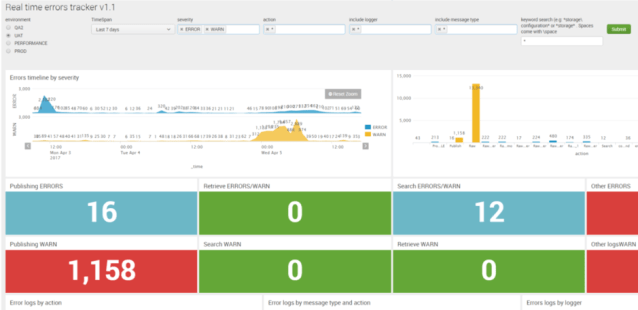
3rd) Create searches and dashboards according to the needs of the team. E.g. All logs, error logs and transactions for Dev and Test, error logs per component per system, no. Of HTTP requests, and HTTP error codes for Business Analysis, Operations and Support, etc.
4th) Give to the team the access and tools they really need. Yes, you can provide access to Kibana to the whole team and everybody’s happy, but why not use the full potential of Elastic Search? If I would be doing the testing, I would use the Elastic Search REST API to query the events logged by the application from my tests.
At MagenTys we have done ELK implementations from Zero to Hero for a wide range of projects, and not only for software development. It can also be used to ingest and represent the data of sources, such as Jenkins, Jira, Confluence, SonarQube and more!


Don’t like ELK? There are other options for application logging, that can be also extended to your infrastructure, like Azure Monitor.
Azure Monitor
Microsoft has recently changed the names to some of their products and has also grouped them all together. For example, Log Analytics and Application Insights have been consolidated into Azure Monitor to provide a single integrated experience.
Azure Monitor can collect data from a variety of sources. You can think of monitoring data for your applications in tiers ranging from your application, any operating and services it relies on, down to the platform itself
OMS (Operations Management Suite) as such is being retired, moving all its services into Azure Monitor. For those that are currently using it, you should know that by Jan 2019, the transition will be complete and you might have to move into Azure Monitor
Saying that, the new Azure Monitor experience looks like this:
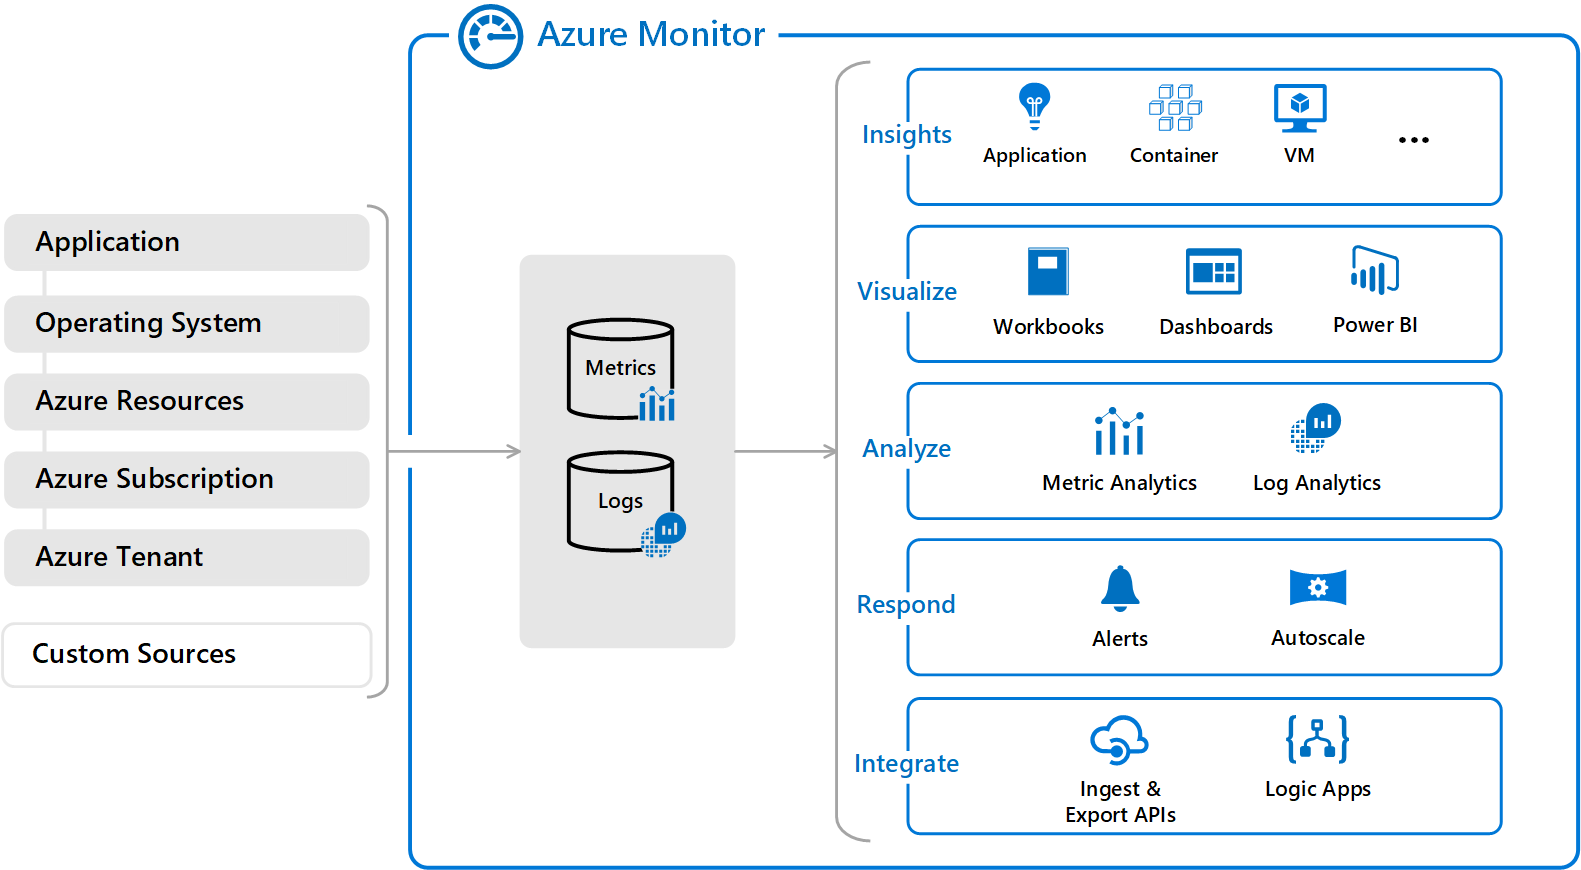
Azure Monitor collects data from each of the following tiers:
- Application monitoring data
- Guest OS monitoring data
- Azure resource monitoring data
- Azure subscription monitoring data
- Azure tenant monitoring data
To compare it with Splunk and ELK, we can leave the operations and resources monitoring aside for a moment and focus on Log Analytics and Application Insights.
Log data collected by Azure Monitor is stored in Log Analytics which collects telemetry and other data from a variety of sources and provides a query language for advanced analytics.
Common sources of data usually are .NET and .NET Core applications, Node.js applications, Java applications and Mobile Apps. But we can import and analyse custom logs too.
There are different ways to use Log Analytics, but mostly is being done through Log Queries:

Remember that with Log Analytics and Log Queries, we are extracting the events created in our log files, organising and parsing them, filtering and then creating our Dashboards, Reports and Alert from them, similar to the Splunk model. With the advantage that we can cross-reference this logs with the information extracted from Application Insights:

Application Insights (which used to be separated from OMS and Log Analytics), is better used for analysing the traffic and actions around your applications. For example, on a web page, it’s straightforward with Application Insights to see the number of web requests, the pageViews, the HTTP Error codes or even analyse the stack trace of the errors captured and link this to our source code.
On the visualisation side,
- Azure dashboards are able to put together all these metrics:

It still has some limitations in terms of customisation of visualisations, but it’s extensible as we can link it to wonderful tools such as PowerBi or Grafana.
Azure Monitor views allow you to create custom visualizations with log data stored in Log Analytics.

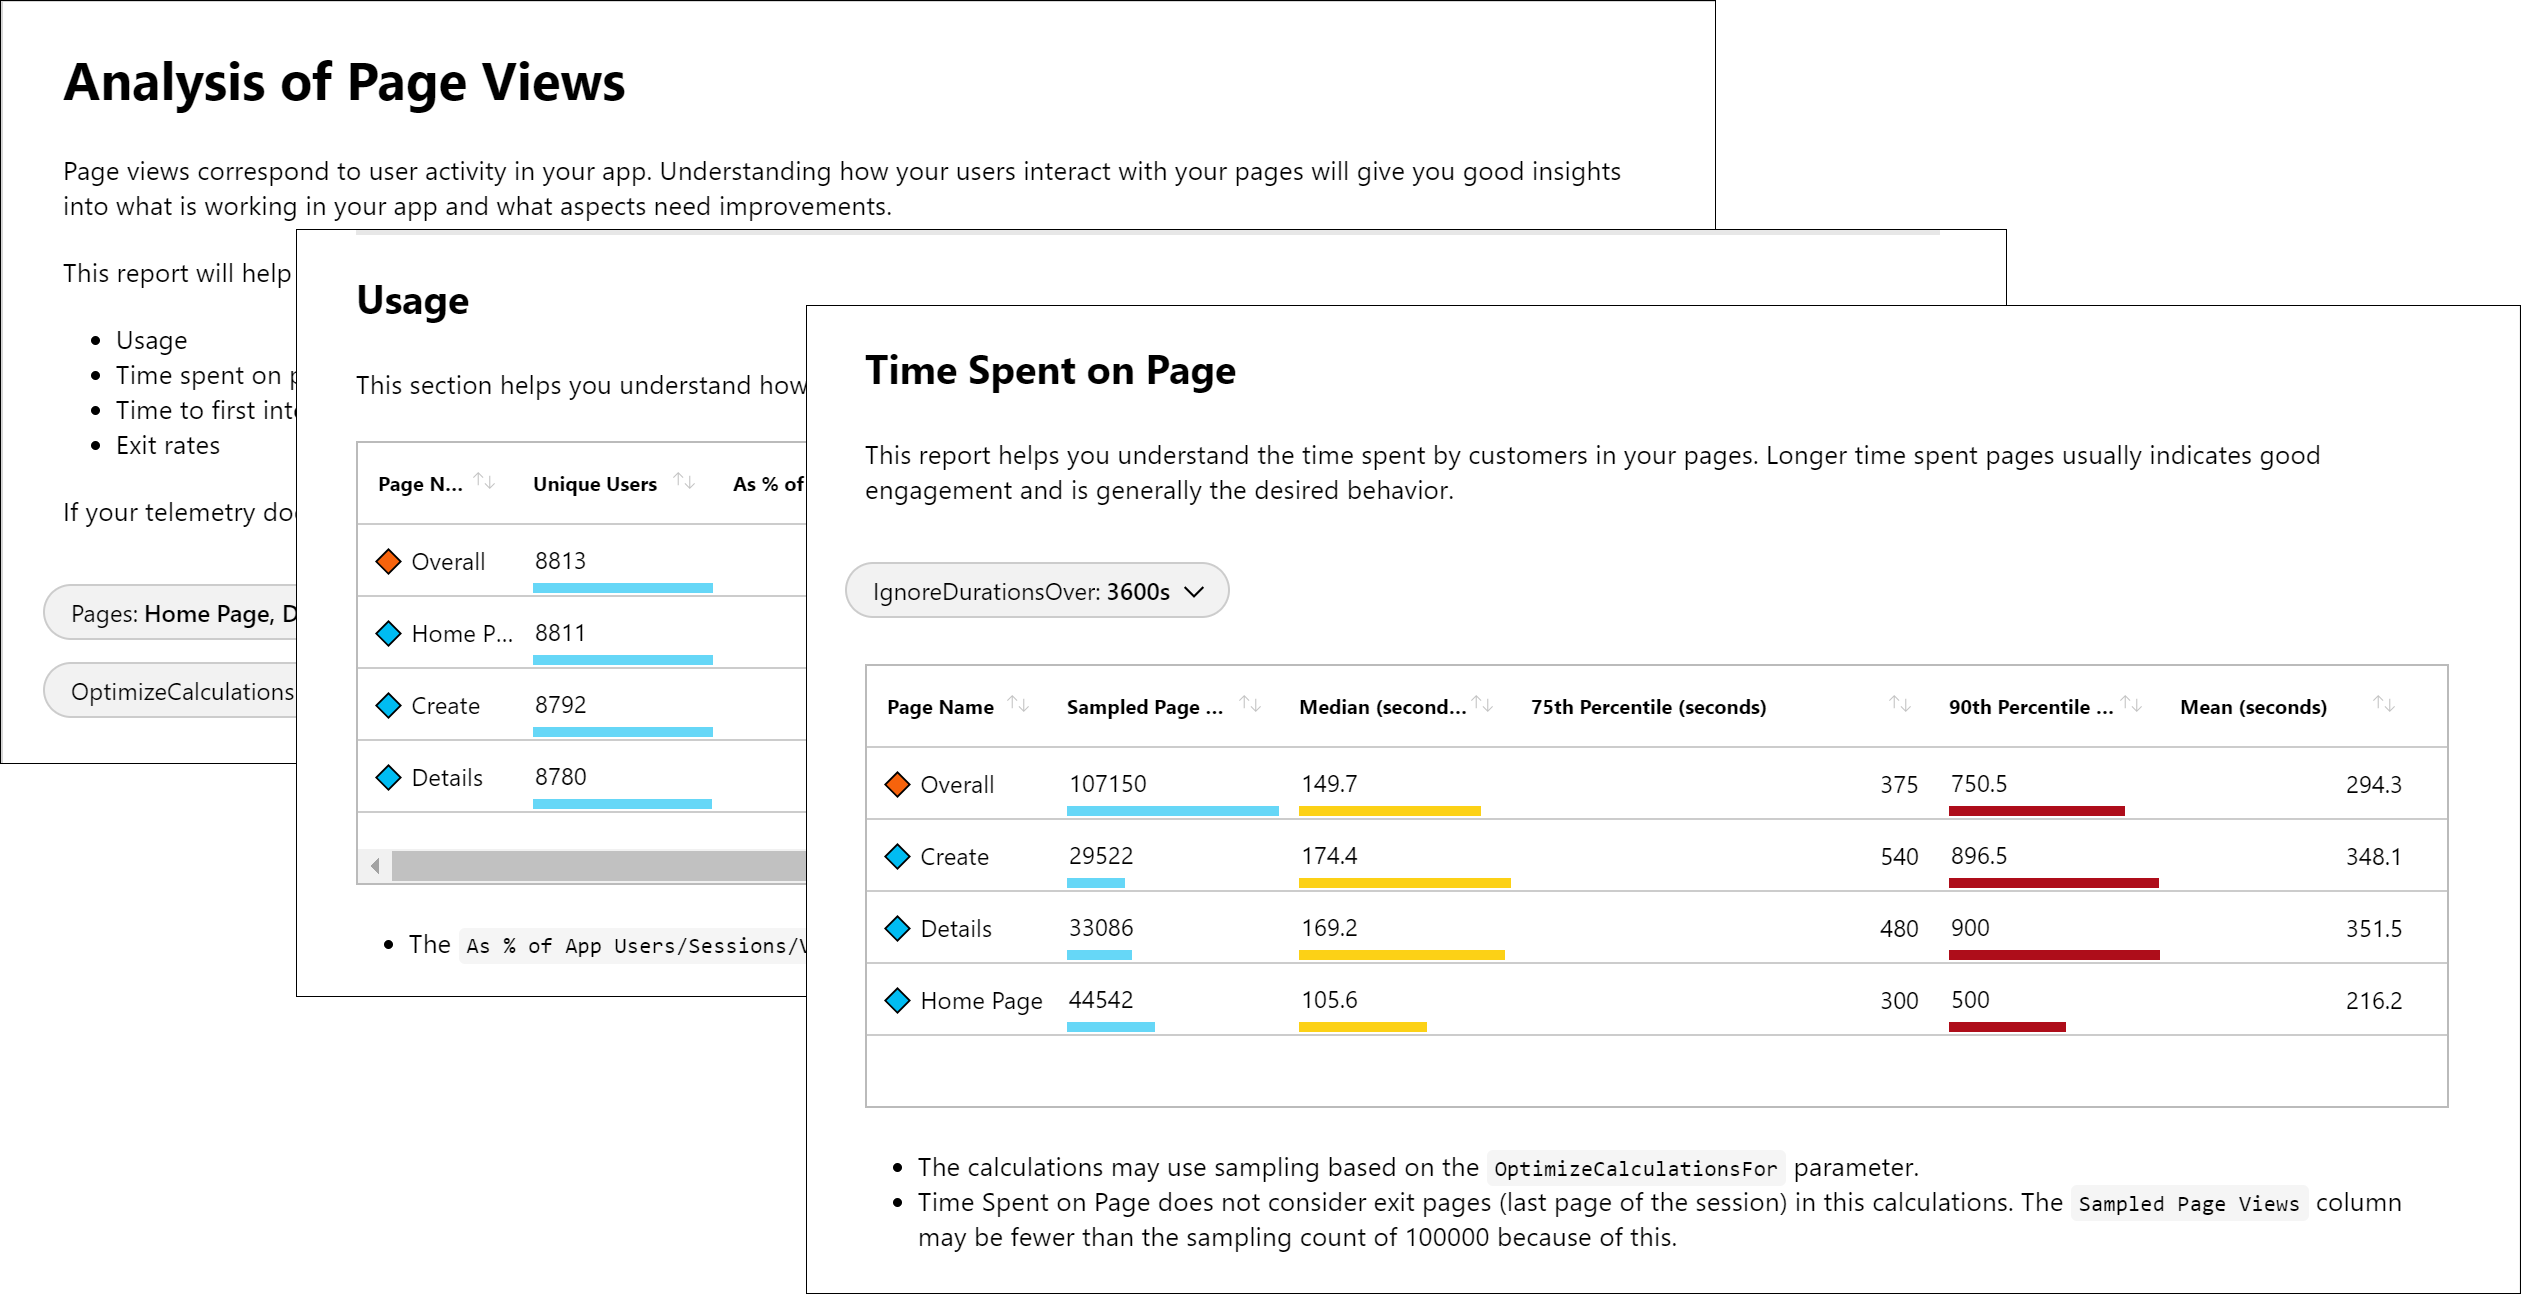
Application Insight workbooks, provides deep insights into your data, to help your development team to focus on the most important.
Last but not least, you can use Log Analytics in conjunction with PowerBi or Grafana, which are “nice to have”. The problem of Grafana is that you can monitor and build metrics but not analyse logs:
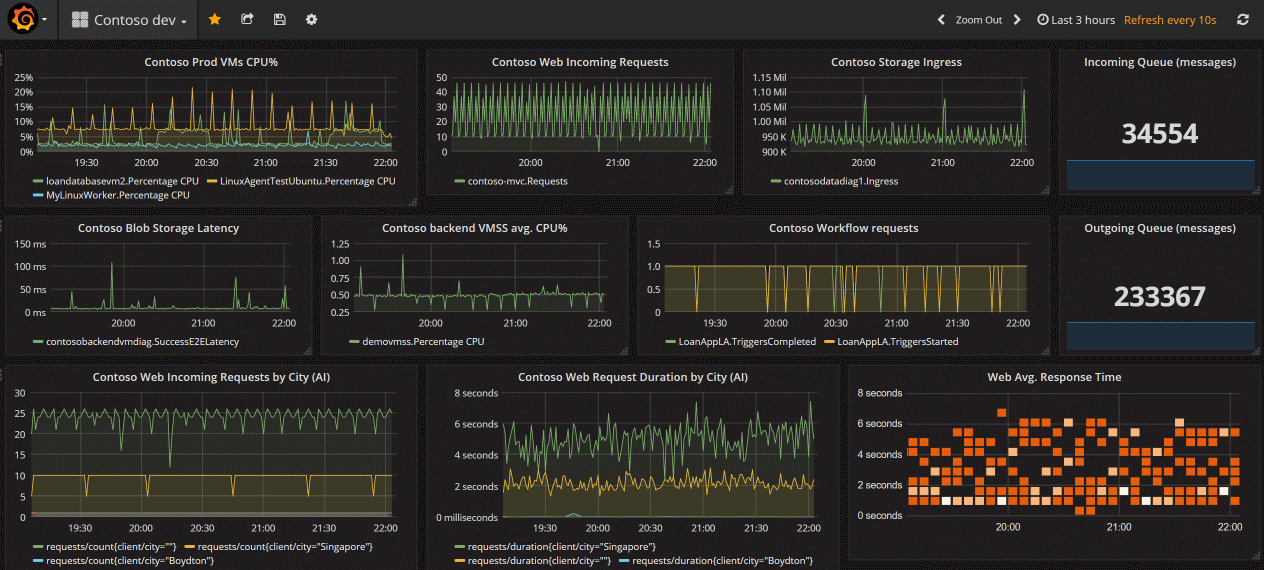
The bright side is that Grafana is Open Source, free and can be used with many many data sources, Elastic Search included.
The last thing to mention, Azure Monitor it’s not free but it’s quite affordable!
In Summary
We have briefly discussed Splunk, ELK and Azure Monitor. What type of data we can extract and analyse, different visualisations, and cost.
Most development teams use ELK as they are used to it or either come from a Java background.
I’m seeing more and more teams using Splunk, which I really recommend but it is still an expensive tool to have.
Azure Monitor, traditionally has been used extensively in Operations (a legacy from System Center family, moved to the cloud, now integrated with other analytic tools) and Performance Testing. Now they bring together the other missing piece, Log Analytics and Application Insights, for application logs analysis, and offers a very good combo of metrics and logs tools for a very good price.
Not to go into deep details about any of those, just mentioning the most common scenarios I’m finding out there.
I hope this information is useful for you!
